Meet

Neura HQ,
Your connected AI Agent Workforce Know more


See which automations drive results, how your audience is growing, and where to focus your efforts with real-time analytics.
Book a demo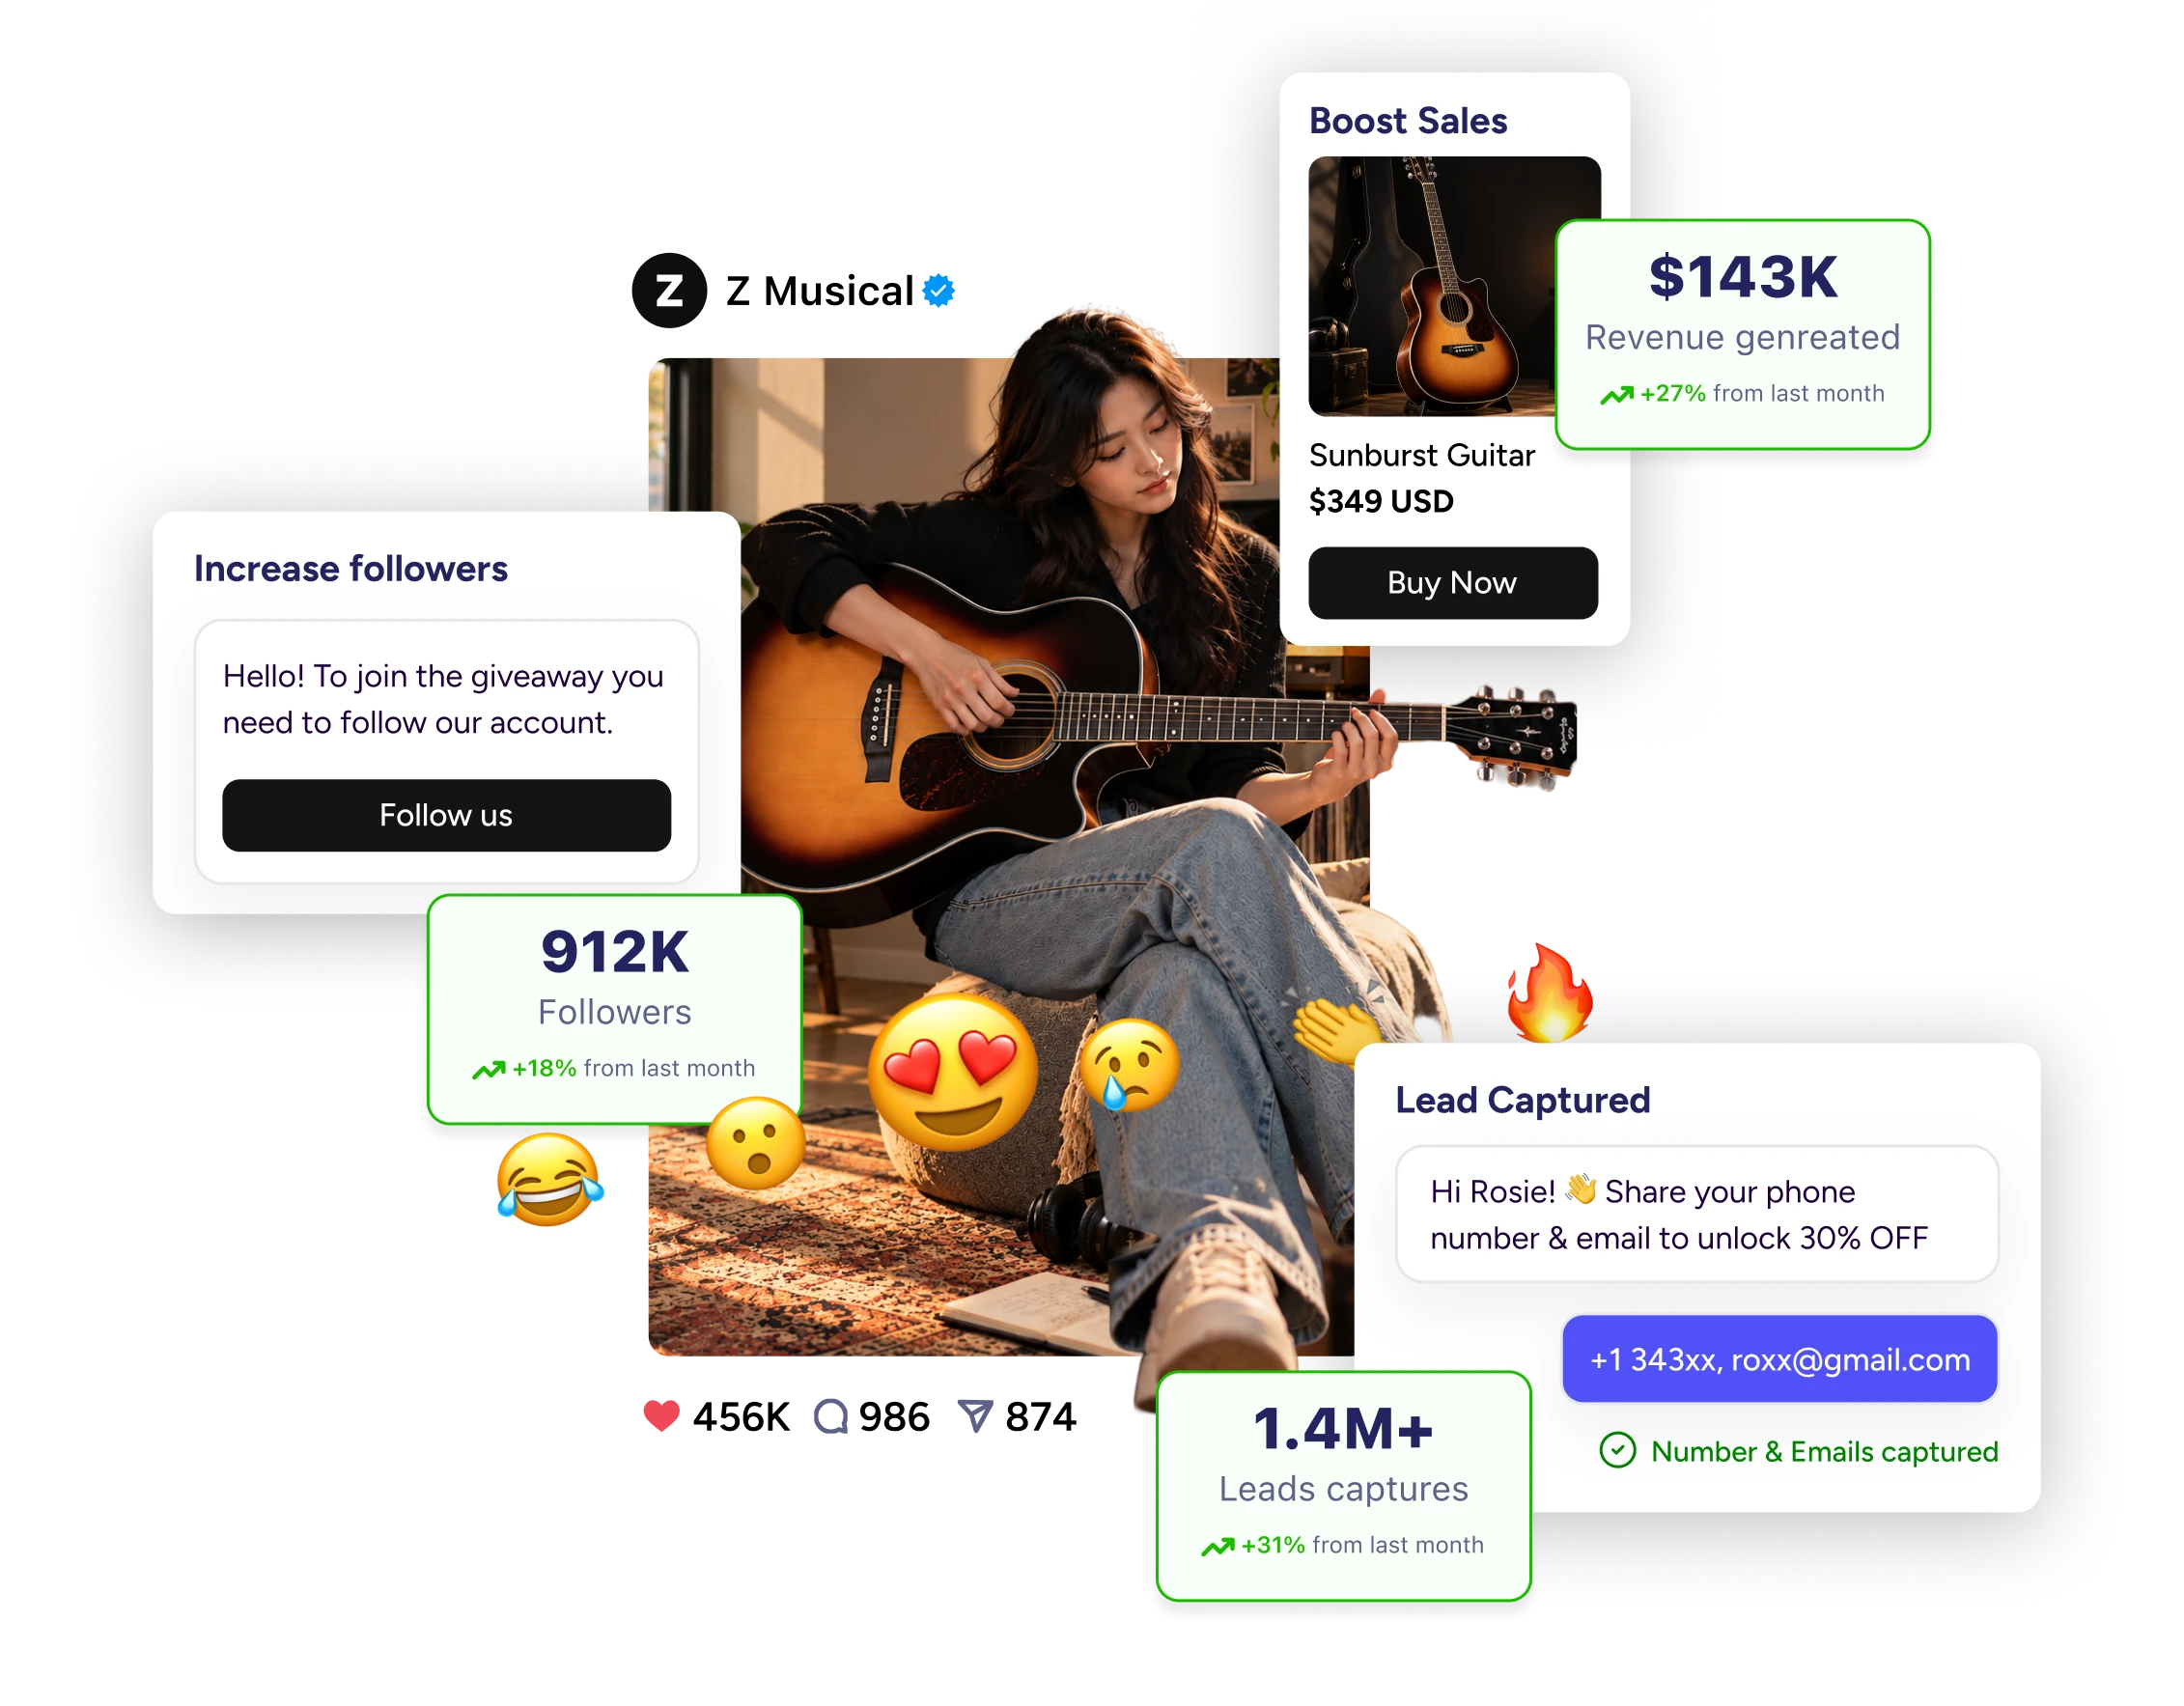






ZEPIC's Instagram Reports give you clear visibility into how your automation performs, how your audience grows, and which strategies drive the best results. Track the metrics that matter most for Instagram marketing success.
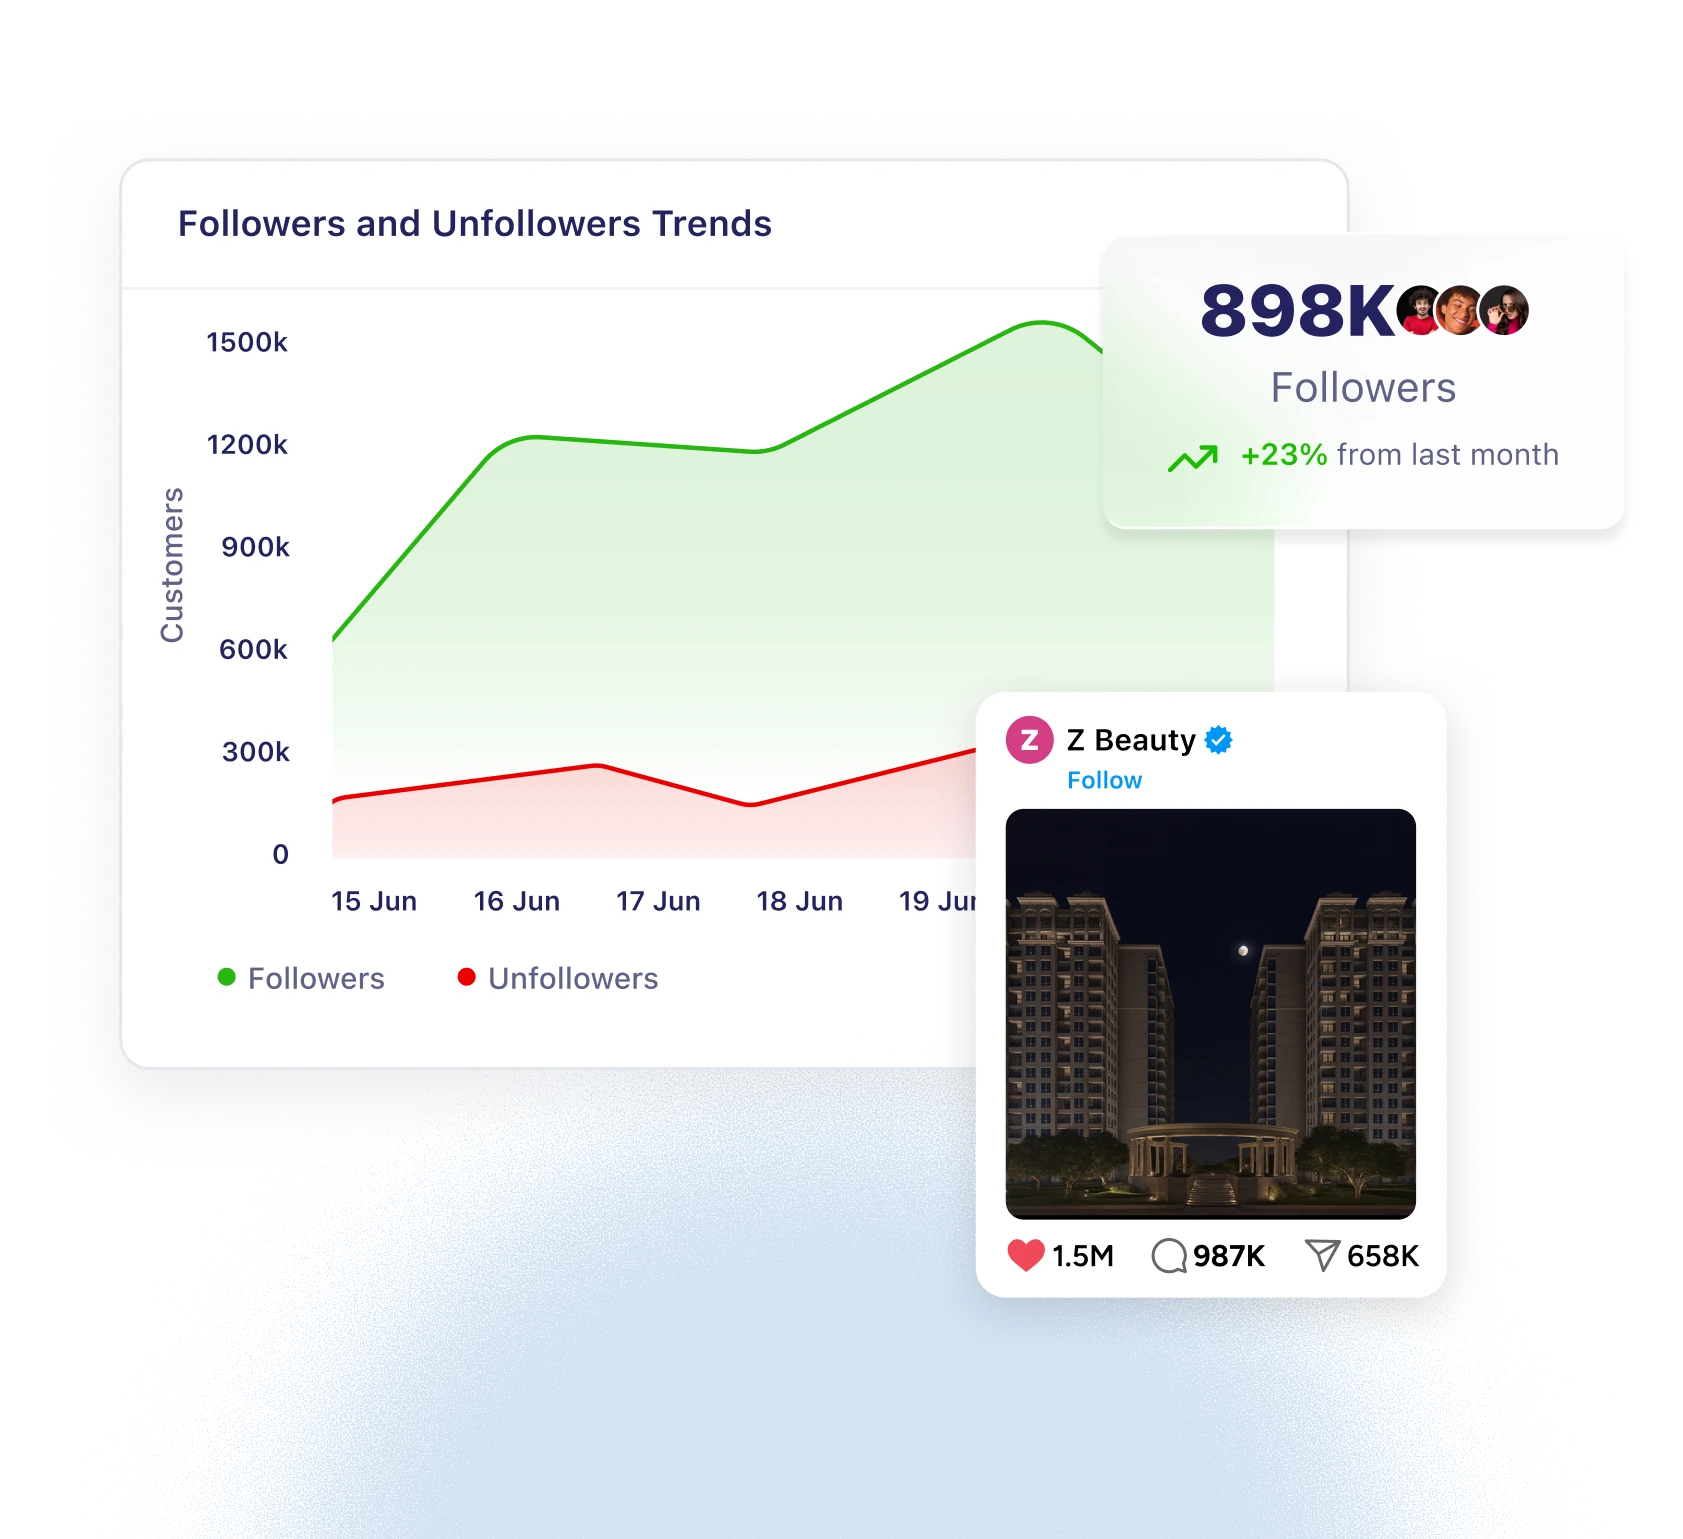
Monitor how your Instagram audience grows over time. See daily, weekly, and monthly follower trends to understand which content and automation strategies drive audience growth.
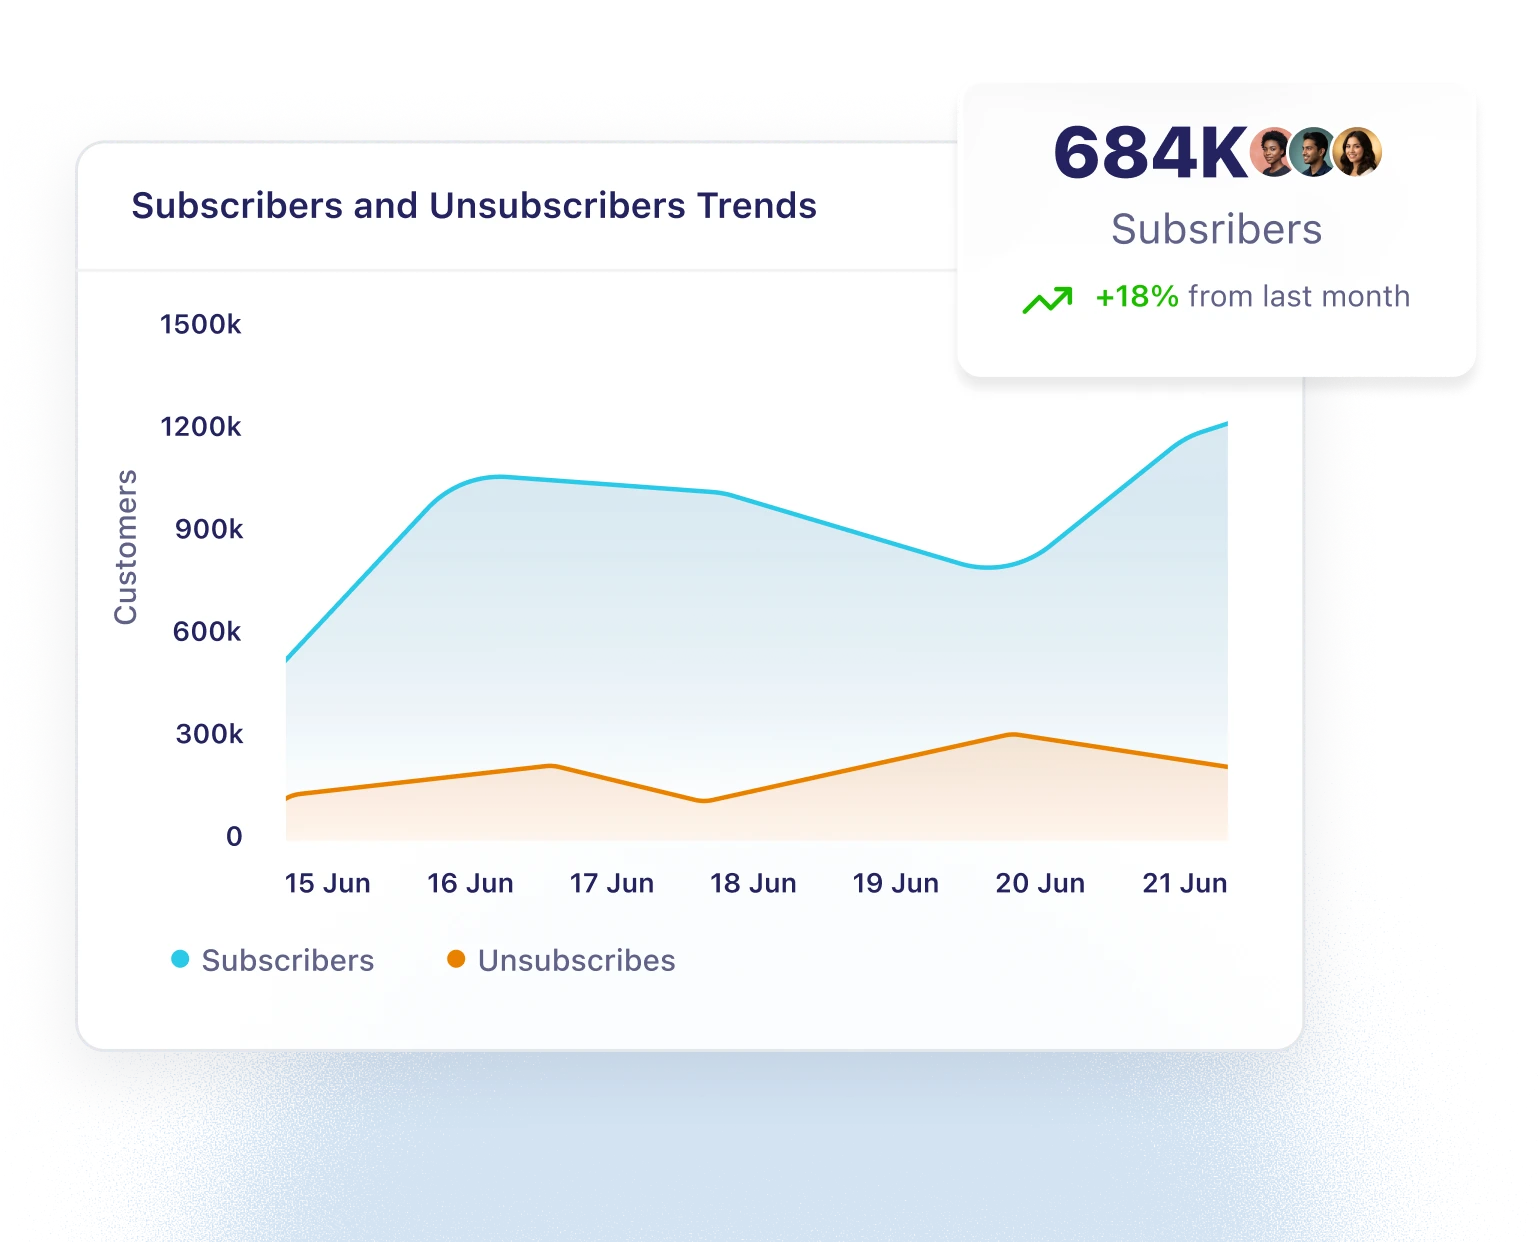
Monitor opt-in and opt-out patterns for your Instagram automation. Understand how many users subscribe to receive messages and track subscription health over time.
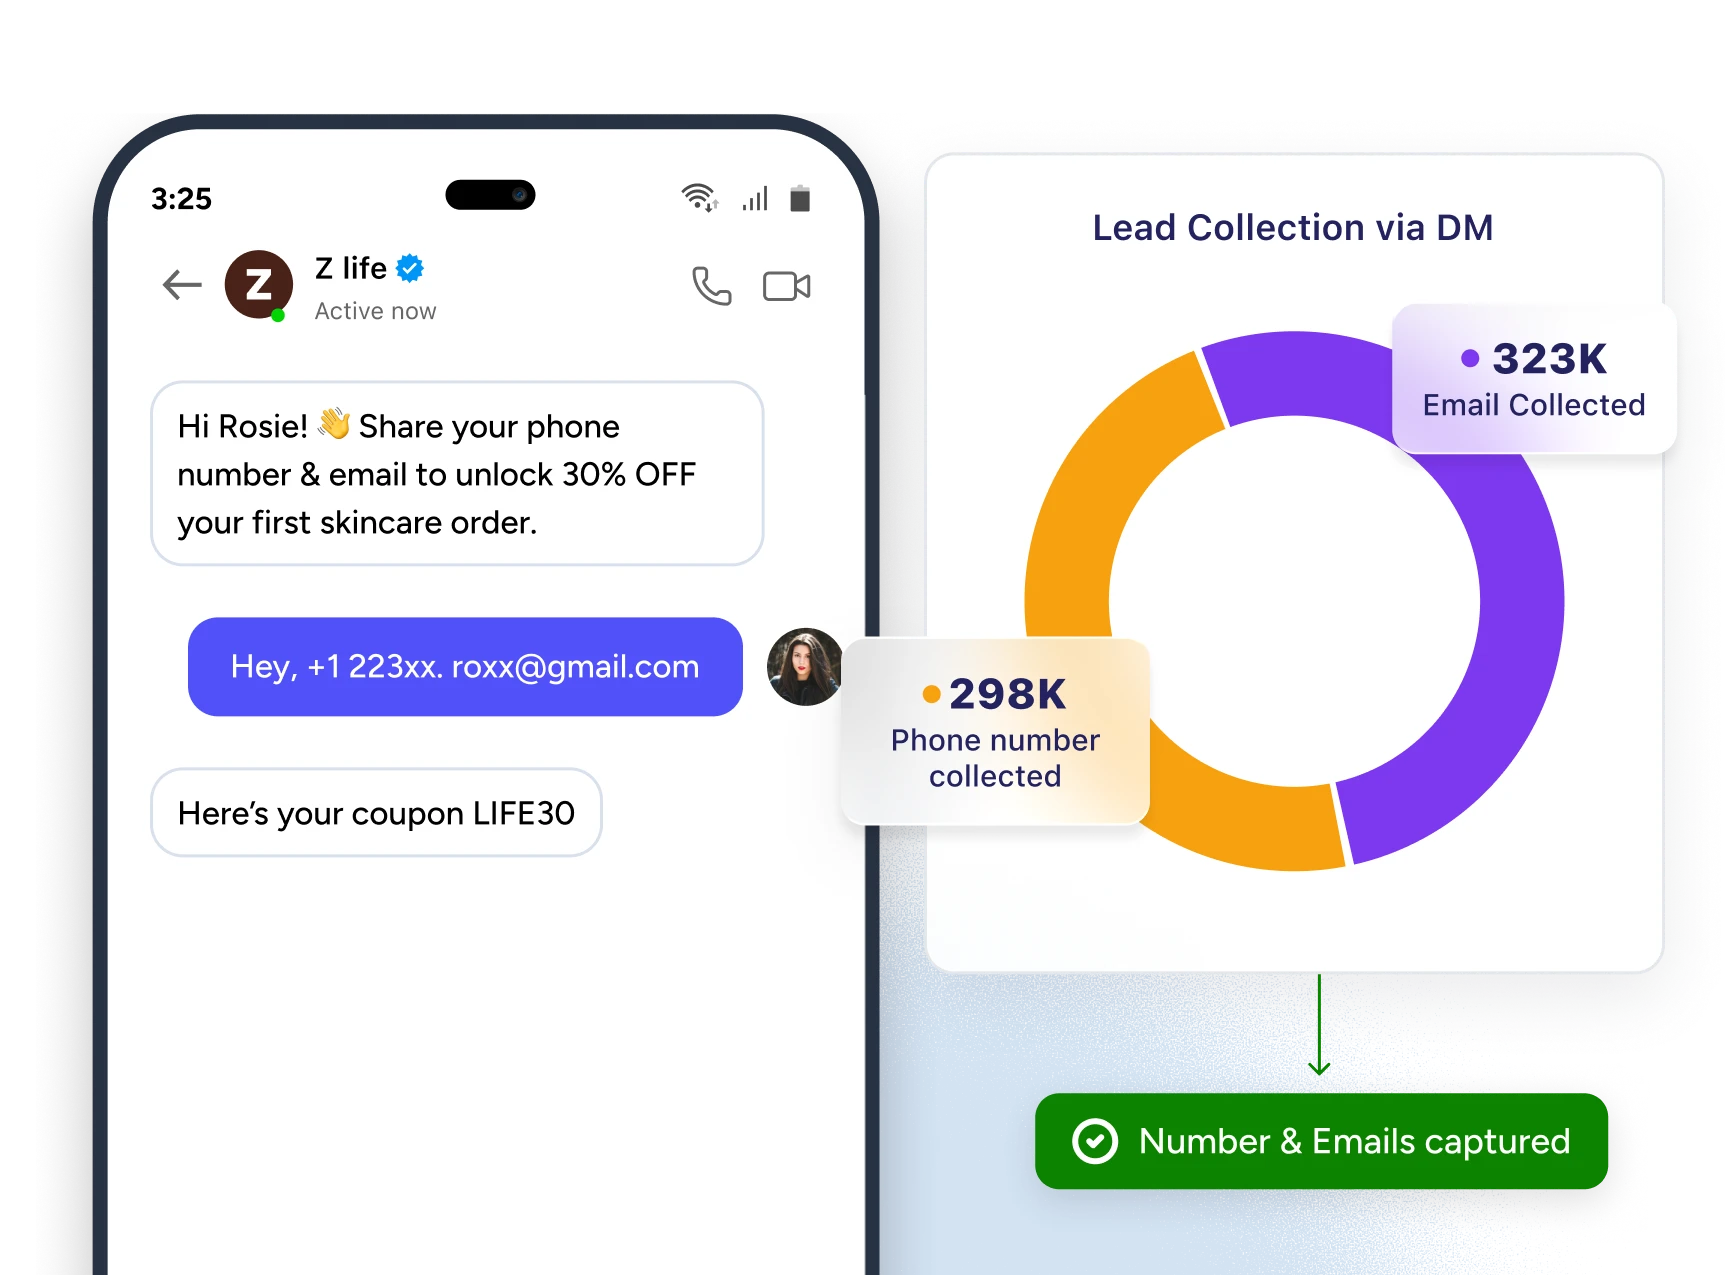
Track how many leads you're capturing from Instagram automation. See email and phone number collection rates over time to measure lead generation performance.
See how many followers you've gained specifically through ZEPIC's automation features like follow-gating and engagement campaigns. Measure the direct impact of automation on audience growth.
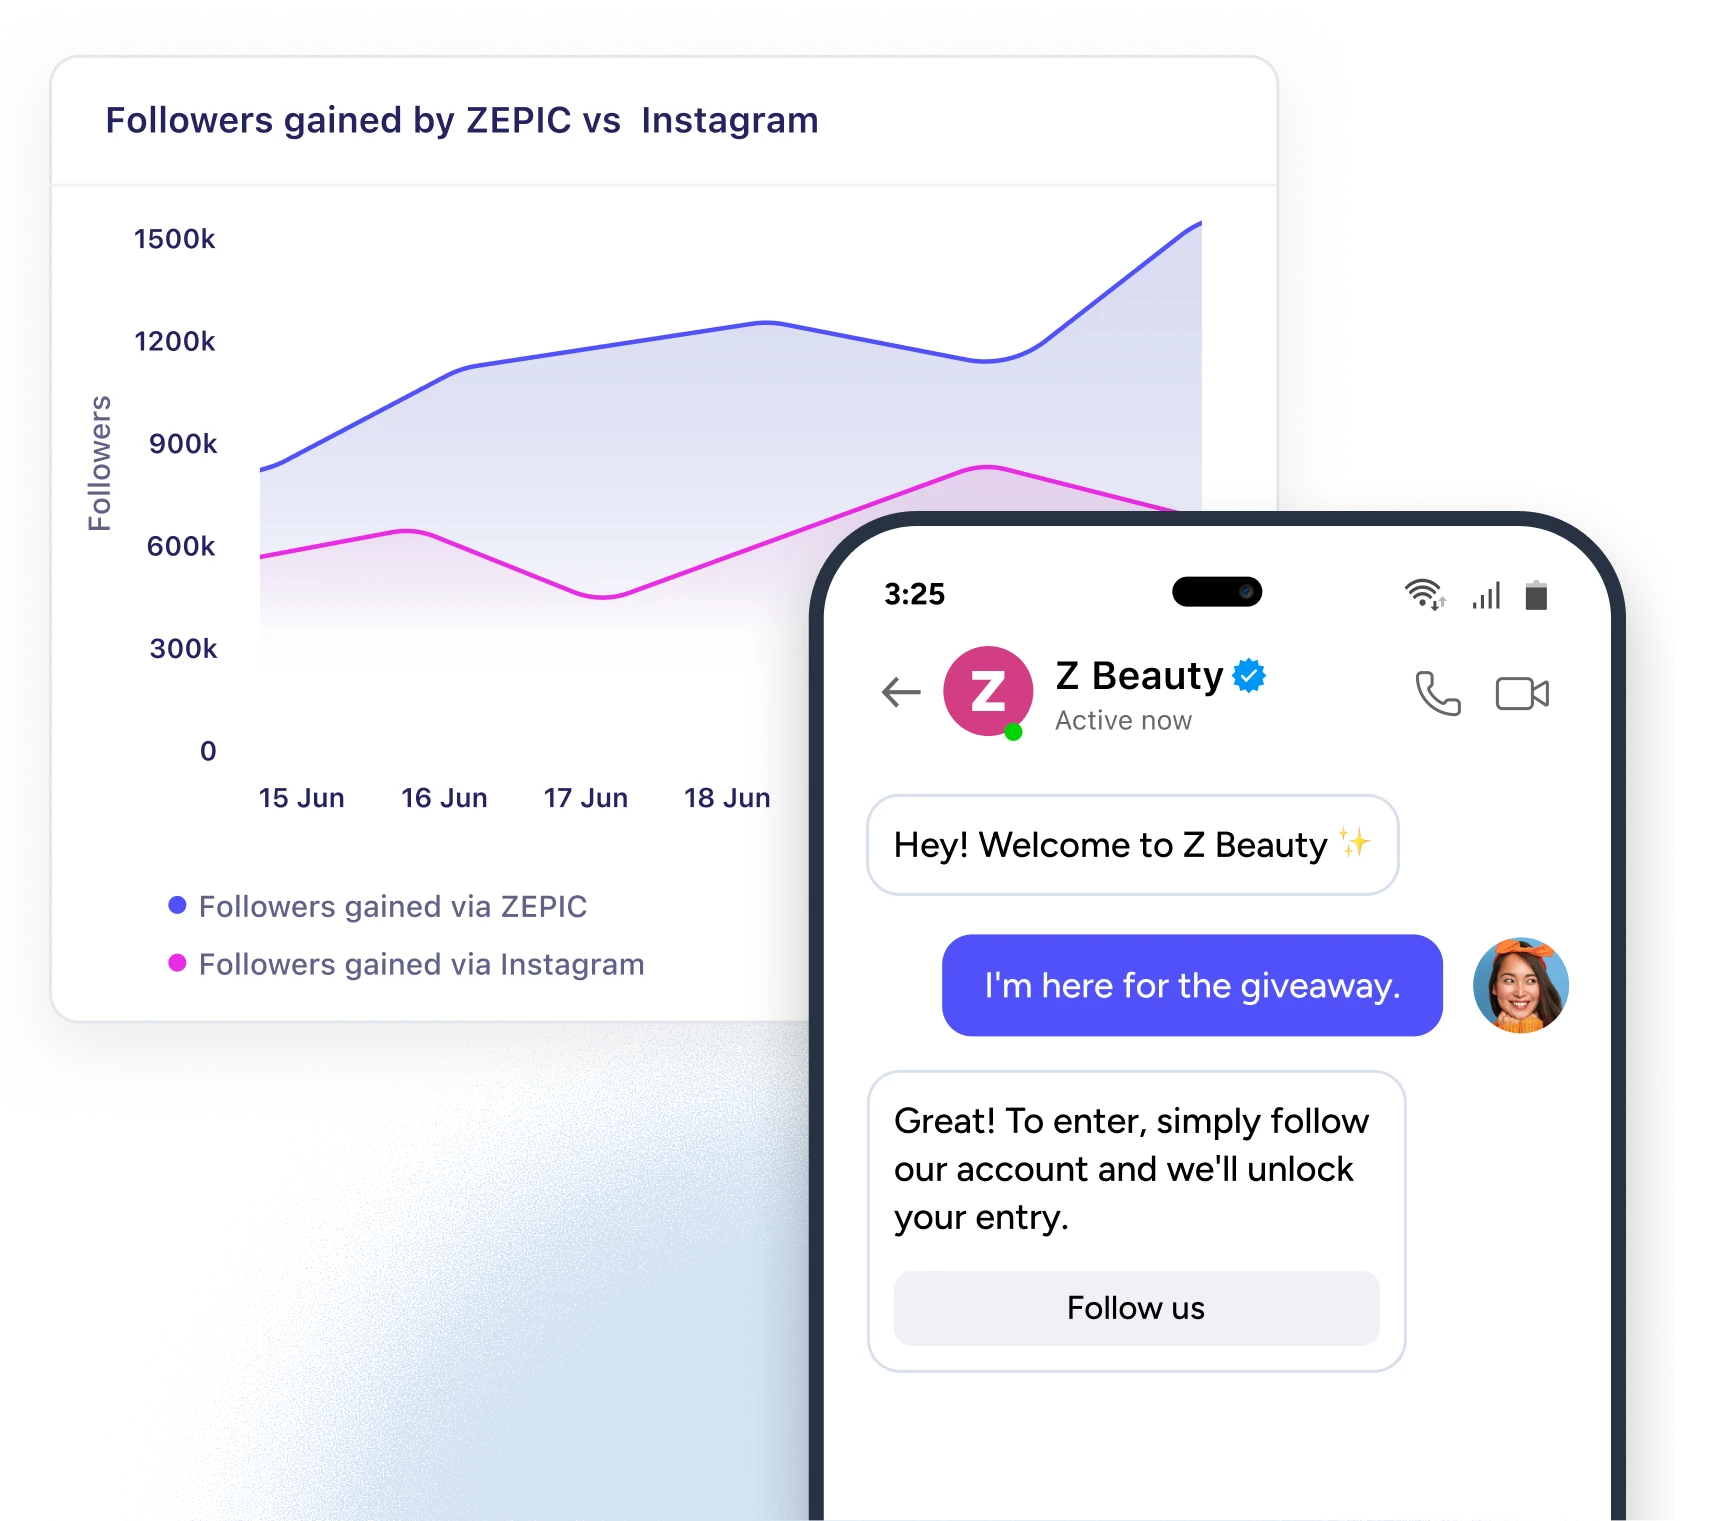
Track Instagram interactions over time including comments, story replies, and DMs. Identify engagement patterns and see which content types generate the most conversations.
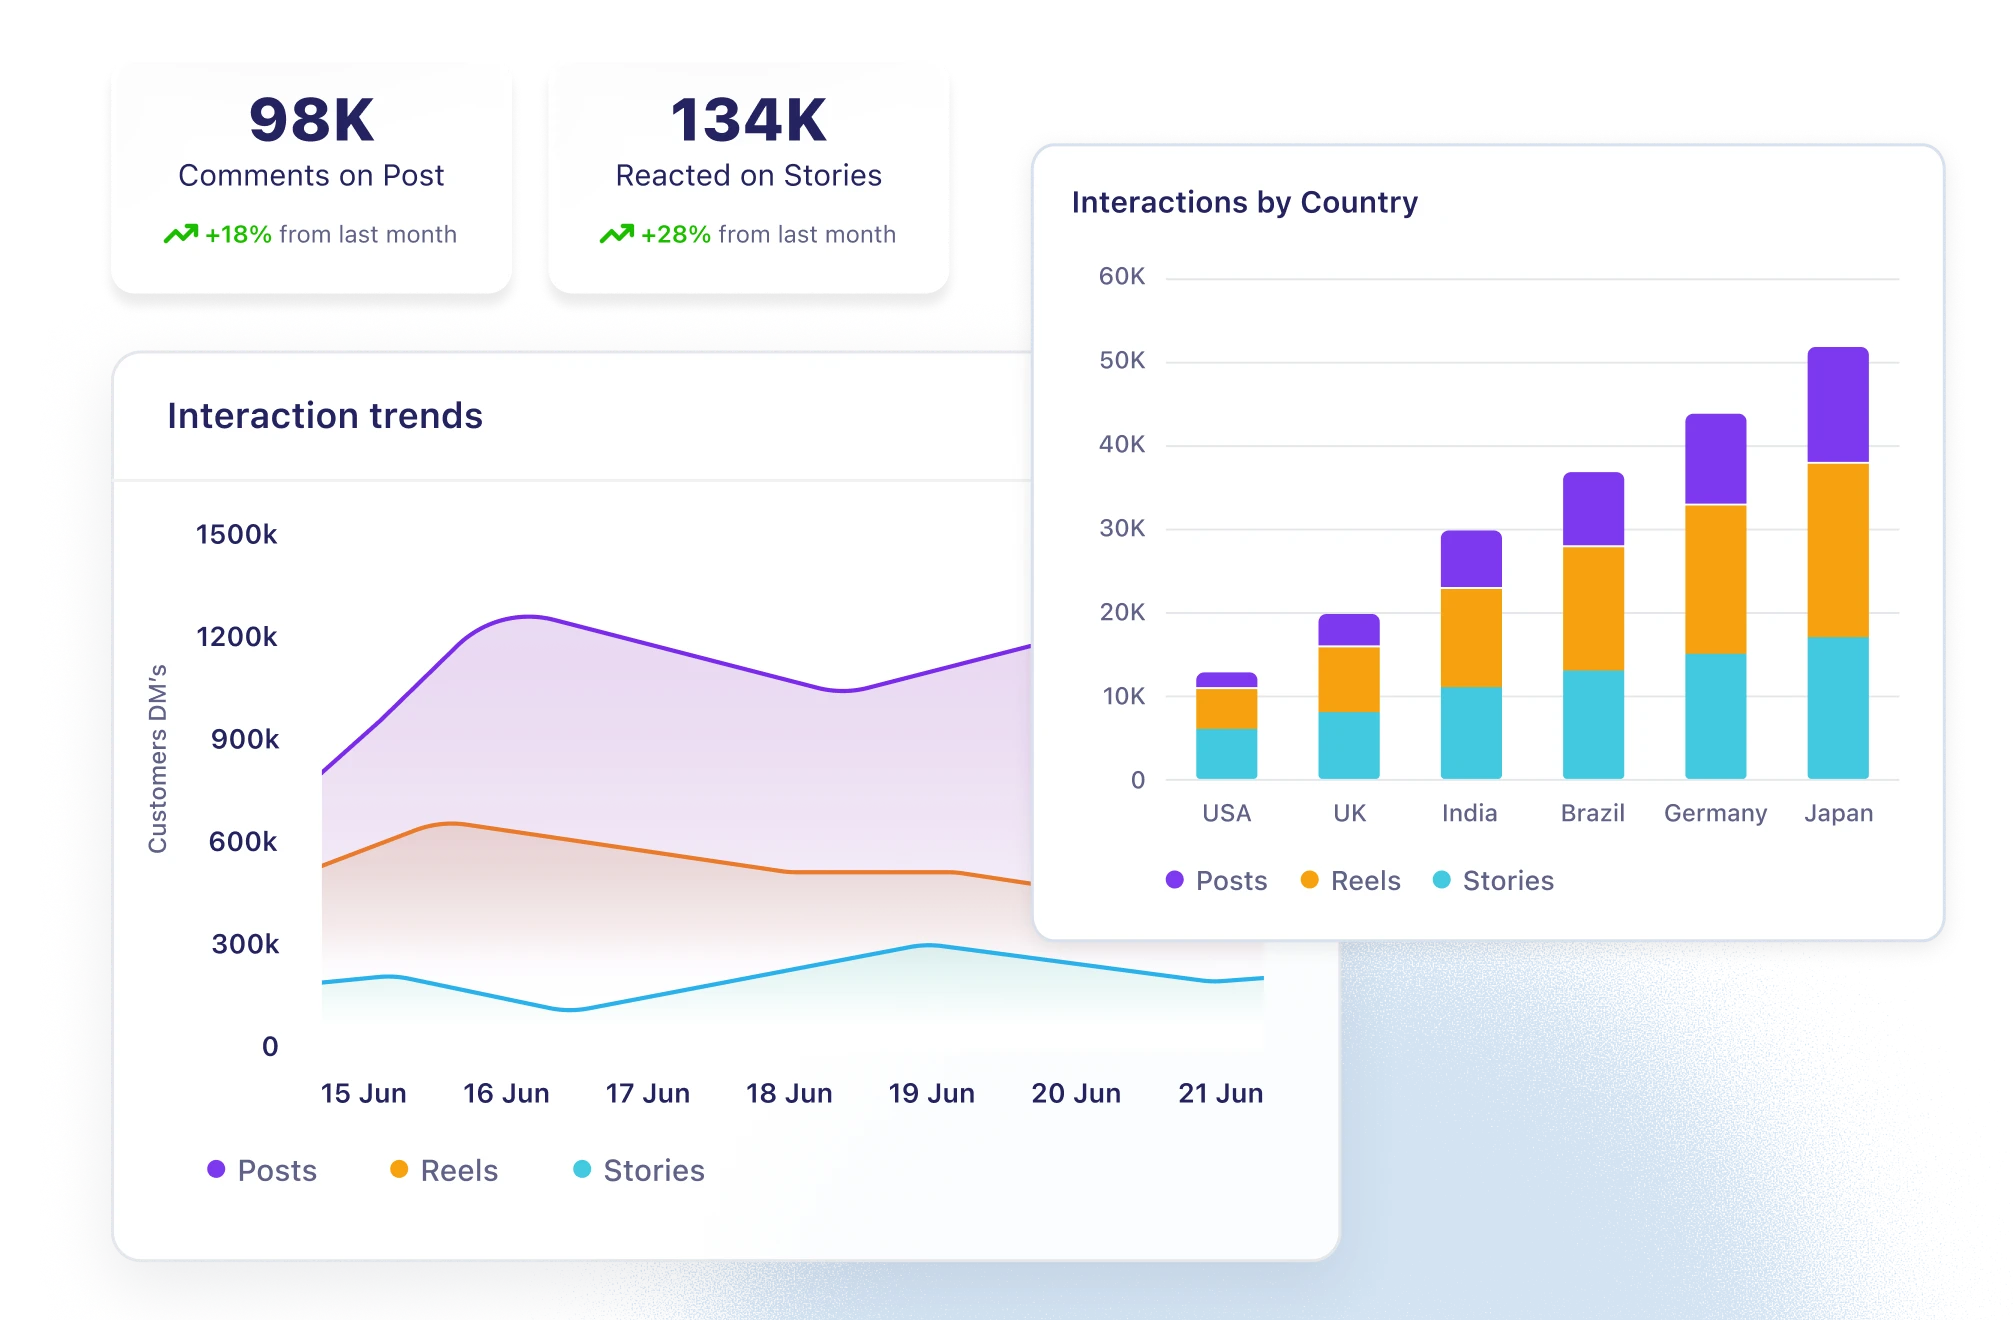
Instagram Reports help you move from guessing to knowing. Instead of wondering which automations work, you see exactly which strategies drive followers, capture leads, and generate engagement. Use these insights to double down on what's working and refine what isn't.

See which posts generate the most comments, which automations capture the most leads, and which time periods drive peak engagement. Replicate your successes with data-backed decisions.

Notice a drop in follower growth or lead collection? Instagram Reports surface trends before they become major issues, giving you time to adjust your strategy and maintain momentum.

Show stakeholders the concrete results of Instagram automation: X new followers, Y leads captured, Z engagement increase. Turn Instagram from a "nice to have" into a proven revenue channel.

As your engagement grows, use reporting data to ensure your automations are handling the increased volume smoothly without losing the human touch as you scale.
Get clear visibility into what's working and optimize your Instagram strategy with data-driven insights.
Book a DemoInstagram Reports update in real-time as data flows in from your Instagram account. Follower trends, lead collection, and interaction metrics refresh continuously so you always see current performance.
Yes. Reports show performance broken down by time periods and metrics, allowing you to correlate spikes in leads or interactions with specific posts, campaigns, or automation changes.
Instagram Reports focus specifically on Instagram metrics, but because all data flows to unified customer profiles, you can see cross-channel behavior in customer analytics. For example, track how Instagram leads perform in email campaigns or how Instagram engagement influences purchases.
You can view Instagram Reports across custom date ranges to analyze specific time periods. Compare week-over-week, month-over-month, or analyze campaign-specific windows to understand performance trends.


