If you’re a marketer, odds are you aren’t a fan of numbers glaring at you from rigid spreadsheets, especially when they fail to show the true impact of your efforts. To make matters worse, you constantly face the pressure of justifying every dollar of marketing spend to leadership without the right data to back you up.
You know your campaigns work, but trying to prove it with fixed templates that do not fit your business model is a constant battle. When you need defensible insights, you are often forced to submit a ticket to your data team and wait.
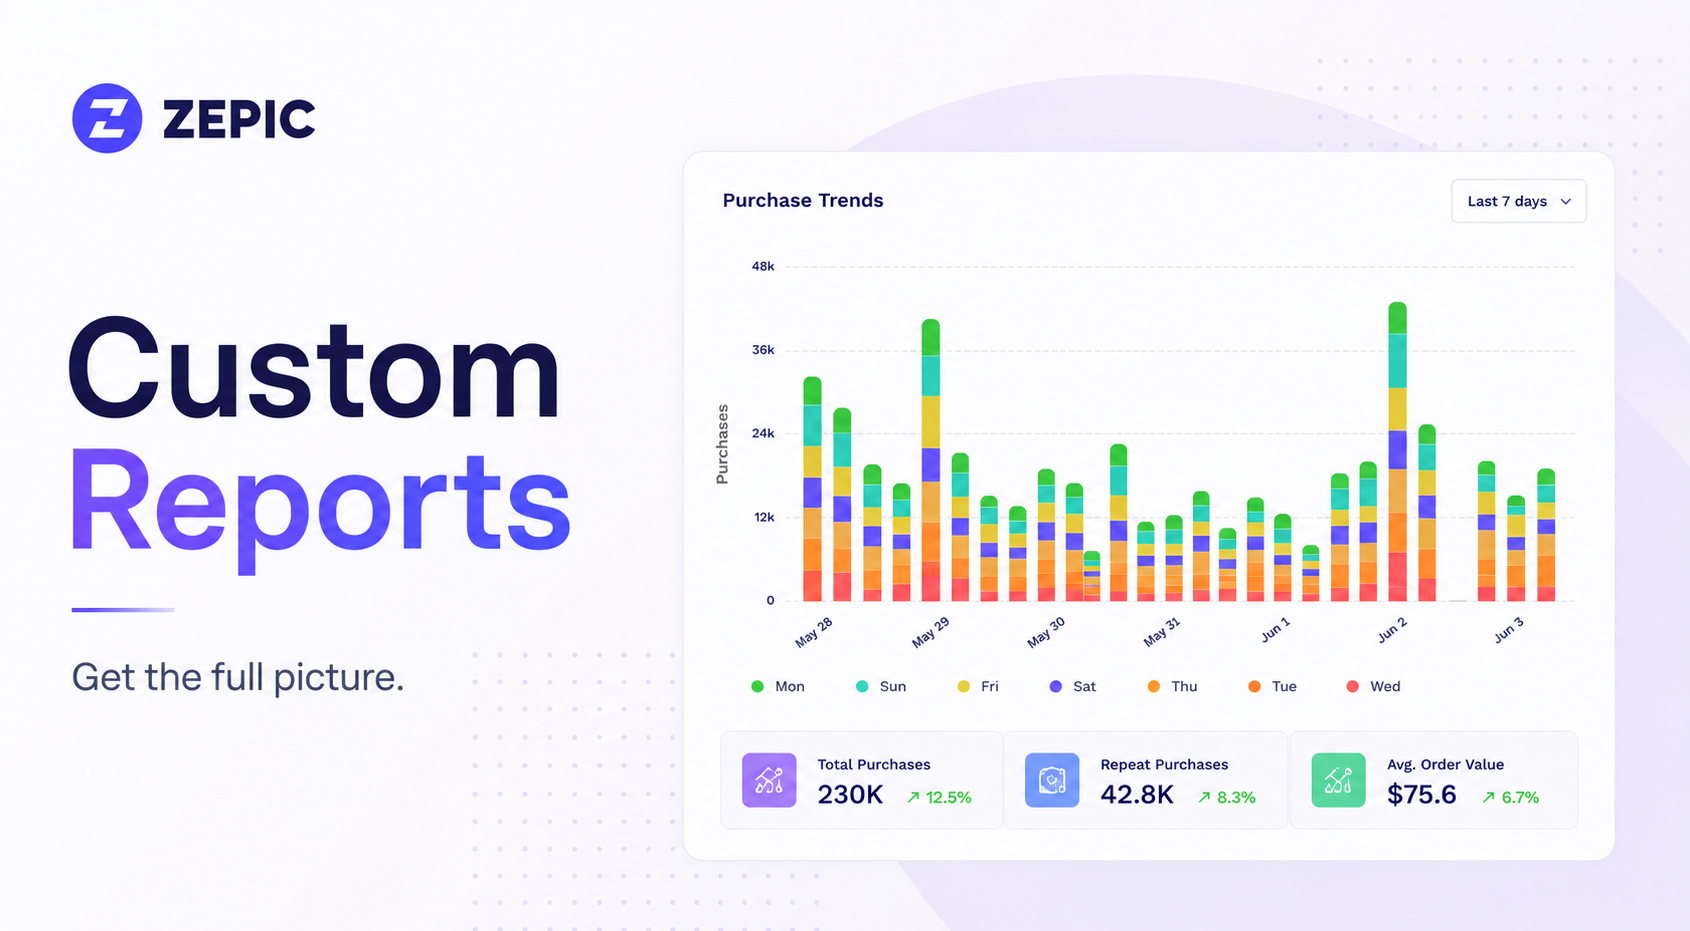
We built ZEPIC Custom Reports to eliminate this exact bottleneck. Our flexible, drag-and-drop canvas gives you the freedom to bring your numbers to life in just a few clicks. It allows you to track high-level leadership KPIs and drill down into granular customer details within a single platform.
Let’s dive into what custom reports are and why you need them.
Core Features of Custom Reports
Custom Reports in ZEPIC is a blank canvas that allows you to create reports based on any data.
Complete Data Object Access: Create reports using any object in your system. This includes customers, orders, products, and deals, as well as nested events like email opens, WhatsApp replies, completed purchases, and cancelled orders.
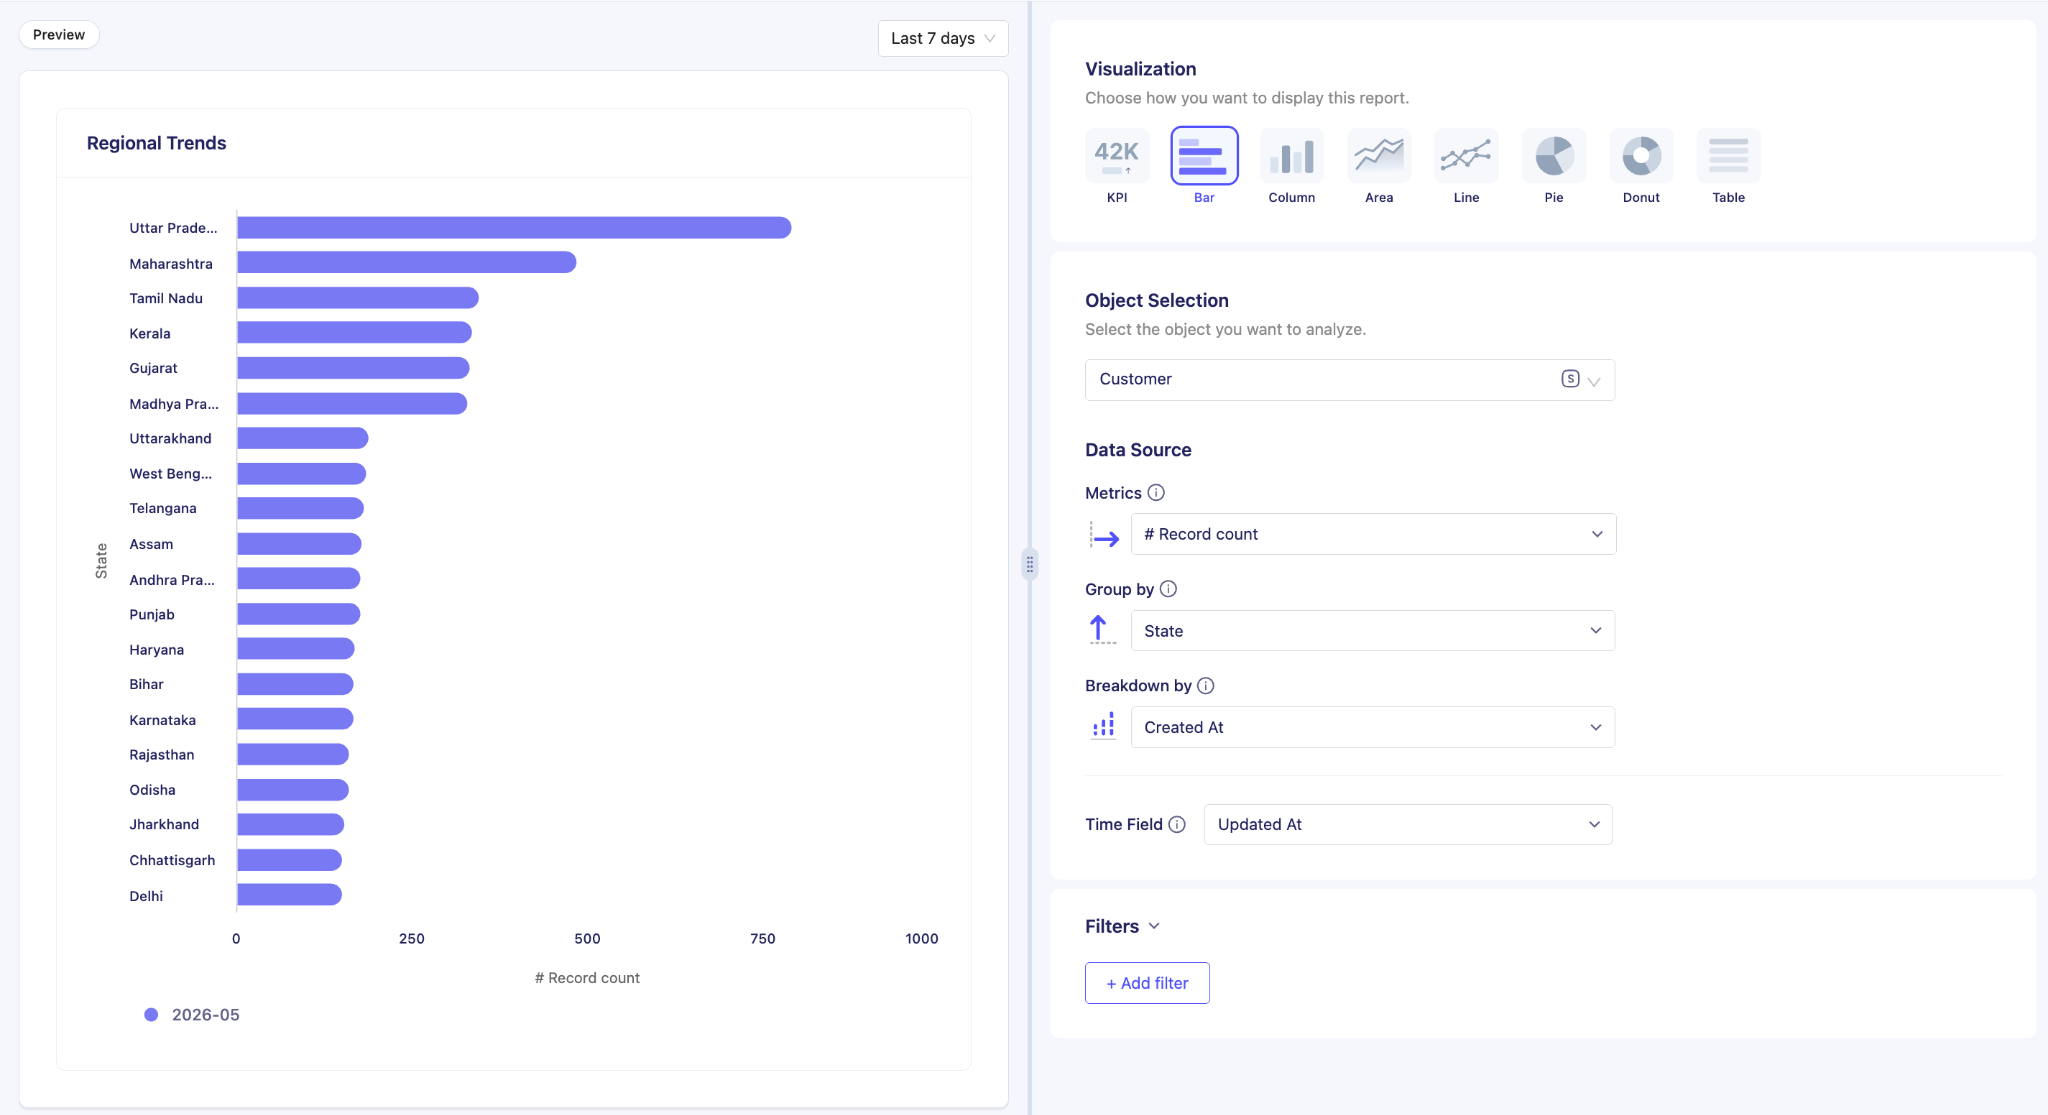
Drag-and-Drop Interface: Build reports from scratch without writing code or waiting on a data analyst. You select the data source, apply filters, and choose your metrics.
Instant Drilldown to Raw Records: Move from macro trends to operational reality with one click. Clicking on any active KPI tile (including Record Count, Event Count, Sum, and Average) instantly displays the raw records behind the numbers.
8 Versatile Visualization Options: Present data to match your audience's preferences. Choose between high-impact KPI tiles, horizontal bar charts, vertical column charts, line graphs, area charts, pie charts, donut layouts, or granular raw data tables.
Unified Boards with Date Filters: Group related reports into a single Board. Changing the date range filter on a Board automatically updates every report on that board simultaneously.
Granular Access Control: Manage visibility at the board level. Keep boards private for personal analysis, or set them to public for team access. Owners, admins, and managers can edit boards, while other roles receive view-only access.
Built-in Period-over-Period Comparisons: Benchmark your current performance against historical data. Toggle the comparison feature on to automatically compare current timelines against the previous matching period.
Reusable Report Configurations: Copy reports across multiple boards seamlessly. ZEPIC creates an independent copy of the report, meaning you can alter the configuration on one board without affecting the original report.
What Can You Do with ZEPIC’s Custom Reports
With complete control over your data structure, you can build custom reports to address specific business challenges.
1. Full Funnel Leak Detection
Most revenue leaks stay invisible until they become expensive. In ZEPIC, you can build step-by-step funnel analysis reports that connect customers, products, and order statuses across every stage of the purchase journey.
Whether the drop-off happens between browse and cart, cart and checkout, or first and second purchase, you can pinpoint the exact stage where customers are leaving. Once you find the leak, you have the customer-level detail to act on it immediately, without opening another tool or submitting a data request.
2. RFM Analysis for Smarter Retention
Blanket retention strategies waste budget on low-value segments while ignoring the customers who are quietly slipping away.
With an RFM report in ZEPIC, you can segment your entire customer base by recency, frequency, and monetary value in one view. This separates your most profitable customers from those on the verge of churning, so your retention budget goes to the segments where it will actually make a difference.
The result is a retention strategy that is precise, defensible, and built on real purchase behavior rather than gut instinct.
3. Cross-Channel ROI Mapping
Modern customer journeys rarely follow a straight line. A customer might open an email, reply to a WhatsApp message, and then complete a purchase three days later.
In ZEPIC, you can connect these early-stage engagement events directly to final sales outcomes and measure which channel combination drives the most revenue. This gives you a clear, data-backed answer to the question leadership always asks: which channels are actually earning their budget?
4. Cancelled Order Analysis
Cancellations are one of the clearest signals that something in your customer experience is broken, but most tools bury this data. You can build a report that maps cancellation rates by product, by customer segment, and by time period.
Drill into the raw records behind any spike, and you can see immediately whether the problem is concentrated in a specific product or a fulfillment pattern that keeps repeating.
5. First to Second Purchase Gap Analysis
Acquiring a customer is only valuable if they come back. When you track the time between a customer's first and second completed purchase across different segments and acquisition channels, you can identify which cohorts convert to repeat buyers fastest and which ones stall after the first order.
This tells you exactly where to focus your repurchase campaigns and which acquisition channels are bringing in customers who actually stay.
6. New vs. Returning Customer Revenue Split
Most D2C brands know they need to balance acquisition and retention, but very few can see in real time how that balance is actually playing out in revenue.
In ZEPIC, you can build a report that compares revenue, average order value, and order frequency between new and returning customers over any time period. Toggle the period-over-period comparison on, and you can see whether your retention efforts are growing the returning customer share or whether the business is becoming increasingly dependent on acquisition to hit its numbers.
That single view changes the conversation in every leadership meeting that asks whether the marketing budget is being spent in the right place.
7. AOV Trend Analysis by Segment
Average order value tells you what customers spend, and AOV by segment tells you who is actually driving it.
With ZEPIC, you can track average order value over time across your key customer segments and toggle period-over-period comparison to see whether AOV is climbing or declining in each one.
Drill into the raw records behind any dip, and you can see exactly which orders or segments are pulling the number down before it becomes a leadership conversation.
8. Campaign Frequency vs. Revenue
Sending more campaigns feels like doing more, but at a certain point, frequency tips into fatigue and revenue drops. With custom reports, you can build a report that maps the number of campaign touchpoints a customer received against their total order value over any period.
This surfaces the sweet spot between too few touches and too many, so your send frequency is grounded in what actually drives revenue rather than what feels right.
These are just a few of the many possibilities.
The Big Picture and the Finest Detail
ZEPIC Custom Reports gives you the freedom to view your data your way. You can track the headline numbers leadership cares about, then immediately dive into the customer-level detail your marketing team needs to take action. Book a demo today to see custom reports in action!
Desperate times call for desperate Google/Chat GPT searches, right? "Best Shopify apps for sales." "How to increase online sales fast." "AI tools for ecommerce growth."
Been there. Done that. Installed way too many apps. But here's what nobody tells you while you're doom-scrolling through Shopify app reviews at 2 AM—that magical online sales-boosting app you're searching for? It doesn't exist. Because if it did, Jeff Bezos would've bought (or built!) it yesterday, and we (fellow eCommerce store owners) would all be retired in Bali by now. Growing a Shopify store and increasing online sales isn’t easy—we get it. While everyone’s out chasing the next “revolutionary” tool/trend (looking at you, DeepSeek), the real revenue drivers are probably hiding in plain sight—right there inside your customer data. After working with Shopify stores like yours (shoutout to Cybele, who recovered almost 25% of their abandoned carts with WhatsApp automation), we’ve cracked the code on what actually moves the needle. Ready to stop app-hopping and start actually growing your sales by using what you already have? Here are four fixes that will get you there!
The Painful Truth: You're probably losing about 70% of your potential sales to cart abandonment. That's not just a statistic—it's real money walking out of your digital door. And looking for yet another Shopify app for abandoned cart recovery isn't going to fix it if you're not getting the fundamentals right.
The Quick Fix: Everyone knows you need multi-channel recovery that hits the sweet spot between "Hey, did you forget something?" and "PLEASE COME BACK!" But here's the reality—most recovery apps are a one-trick pony. They either do email OR WhatsApp, not both. And don't even get us started on personalizing offers based on cart value—that usually means toggling between three different dashboards while praying your apps talk to each other.
Enter ZEPIC: This is where we come in. With ZEPIC's automated Flows, you can: Launch WhatsApp recovery messages (with 95% open rates!) Set up perfectly timed email sequences (or vice versa) Create personalized recovery offers not just on cart value but based on your customer’s behavior/preferences Track and optimize everything from one dashboard
Fix #2: Reactivate past customers today
The Painful Truth: You're probably losing about 70% of your potential sales to cart abandonment. That's not just a statistic—it's real money walking out of your digital door. And looking for yet another Shopify app for abandoned cart recovery isn't going to fix it if you're not getting the fundamentals right.
The Quick Fix: Everyone knows you need multi-channel recovery that hits the sweet spot between "Hey, did you forget something?" and "PLEASE COME BACK!" But here's the reality—most recovery apps are a one-trick pony. They either do email OR WhatsApp, not both. And don't even get us started on personalizing offers based on cart value—that usually means toggling between three different dashboards while praying your apps talk to each other.
Enter ZEPIC: This is where we come in. With ZEPIC's automated Flows, you can: Launch WhatsApp recovery messages (with 95% open rates!) Set up perfectly timed email sequences (or vice versa) Create personalized recovery offers not just on cart value but based on your customer’s behavior/preferences Track and optimize everything from one dashboard
Offering light at the end of the tunnel is Google’s Privacy Sandbox which seeks to ‘create a thriving web ecosystem that is respectful of users and private by default’. Like the name suggests, your Chrome browser will take the role of a ‘privacy sandbox’ that holds all your data (visits, interests, actions etc) disclosing these to other websites and platforms only with your explicit permission. If not yet, we recommend testing your websites, audience relevance and advertising attribution with Chrome’s trial of the Privacy Sandbox.
Top 3 impacts of the third-party cookie phase-out
Who’s impacted
How
What next
Digital advertising and acquisition teams
Lack of cookie data results in drastic fall in website traffic and conversion rate
Review all cookie-based audience acquisition. Sign up for Chrome’s trial of the Privacy Sandbox
Digital Customer Experience
Customers are not served relevant, personalised experiences: on the web, over social channels and communication media
Multiply efforts to collect first-party customer data. Implement a Customer Data Platform
Security, Privacy and Compliance teams
Increased scrutiny from regulators and questions from customers about data storage and usage
Review current cookie and communication consent management, ensure to align with latest privacy regulations