Meet

Neura HQ,
Your connected AI Agent Workforce Know more

.svg)
Track the headline numbers your leadership cares about, then dive into the customer-level detail your marketing team needs to act on. With ZEPIC’s custom reports, you can get both without switching tools or asking your data team for a favor.
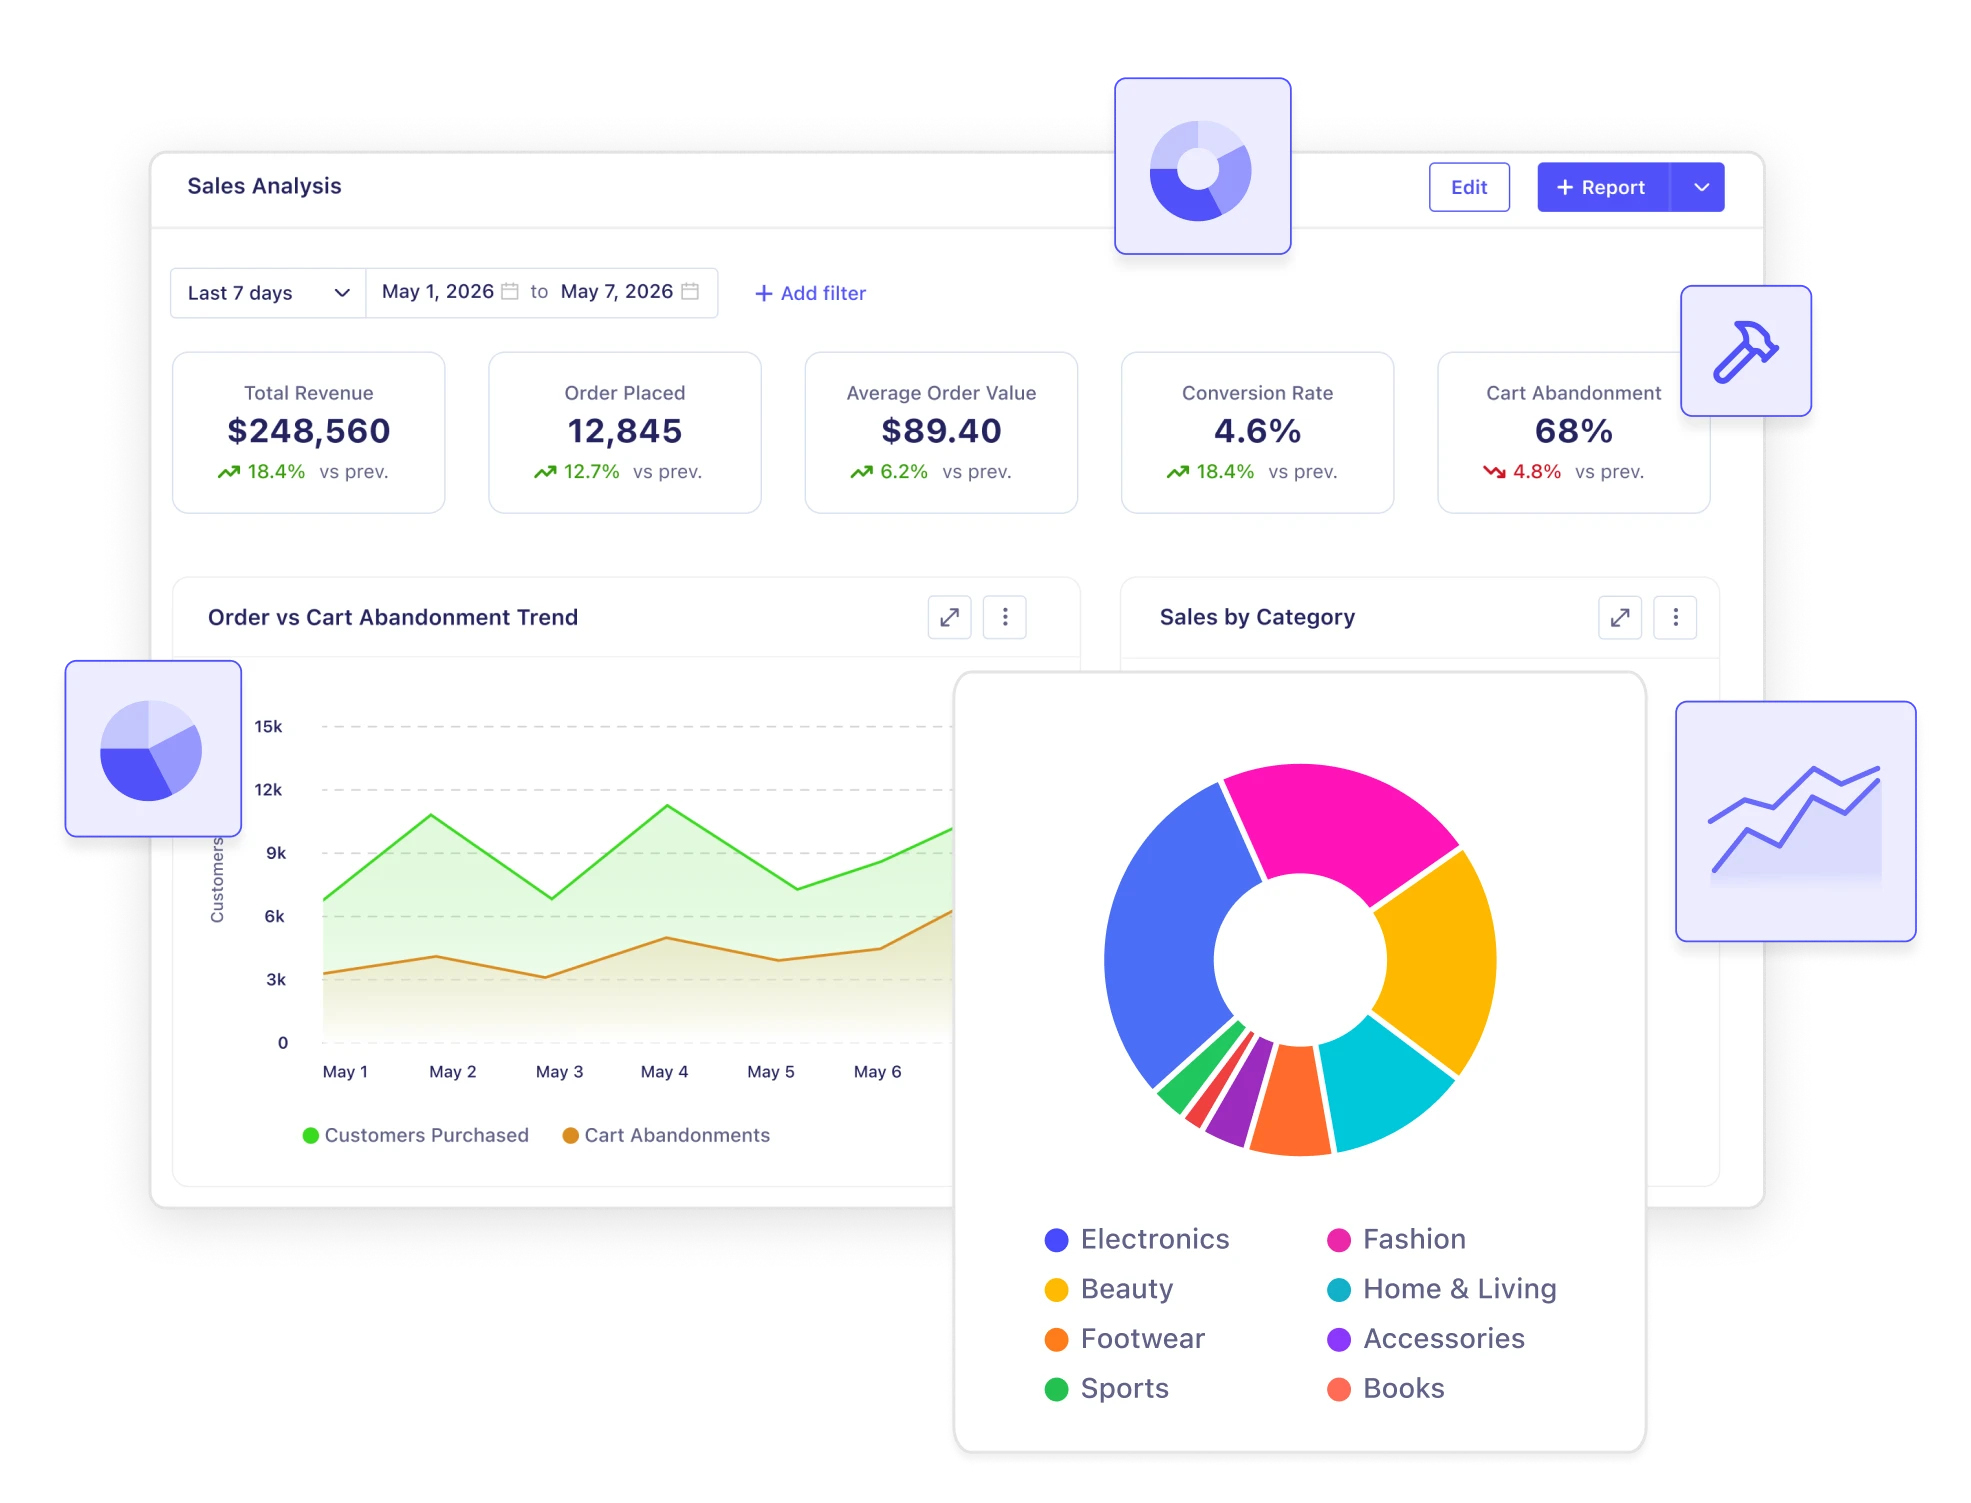






Pull the data points you want from your ecosystem and build reports that answer the questions your business is actually asking.
.svg)
Most revenue leaks are invisible until they're expensive. Build funnel analysis reports in ZEPIC that connect customers, products, and orders to pinpoint exactly which step is costing you money
.svg)
Build RFM analysis in ZEPIC to separate your most profitable segments from customers on the verge of churning so every retention dollar goes where it should.
.svg)
Group every metric that matters into a single board—campaign performance, revenue outcomes, and channel data—and give every team the view they need.
.svg)
ZEPIC gives you a completely blank canvas to build custom reports that seamlessly map cross-channel engagement from email opens to WhatsApp interactions, directly to actual sales outcomes.
ZEPIC's Custom Reports give you the freedom to build any report, visualize it your way, and drill down into the data—so you can pinpoint which segments drive profit and where every marketing dollar goes.
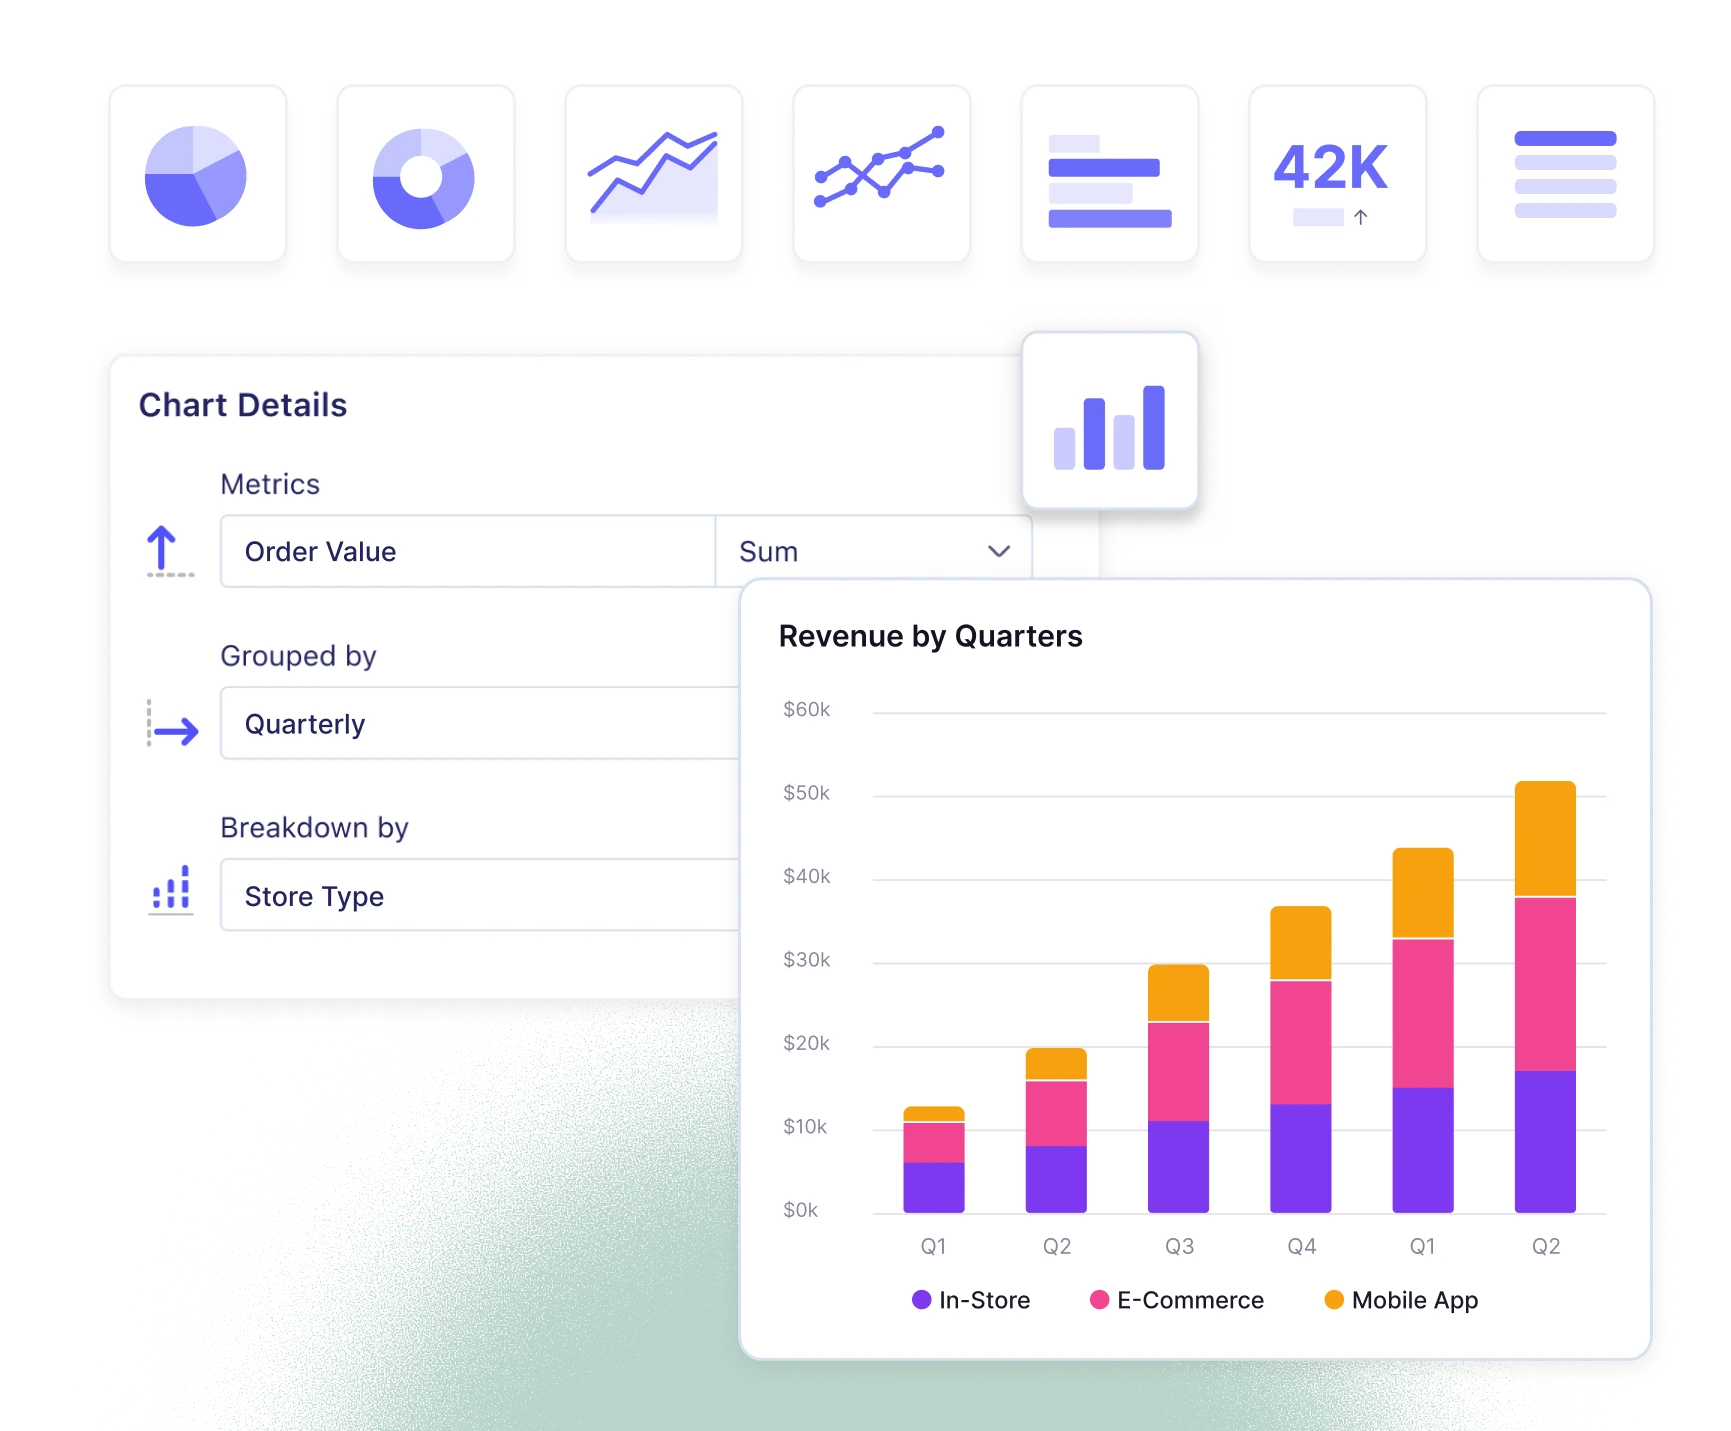
Present your data stories exactly how your audience needs to see them. Choose between high-impact KPI tiles, horizontal bar charts, vertical column charts, line graphs, area charts, pie charts, donut layouts, or granular raw data tables.
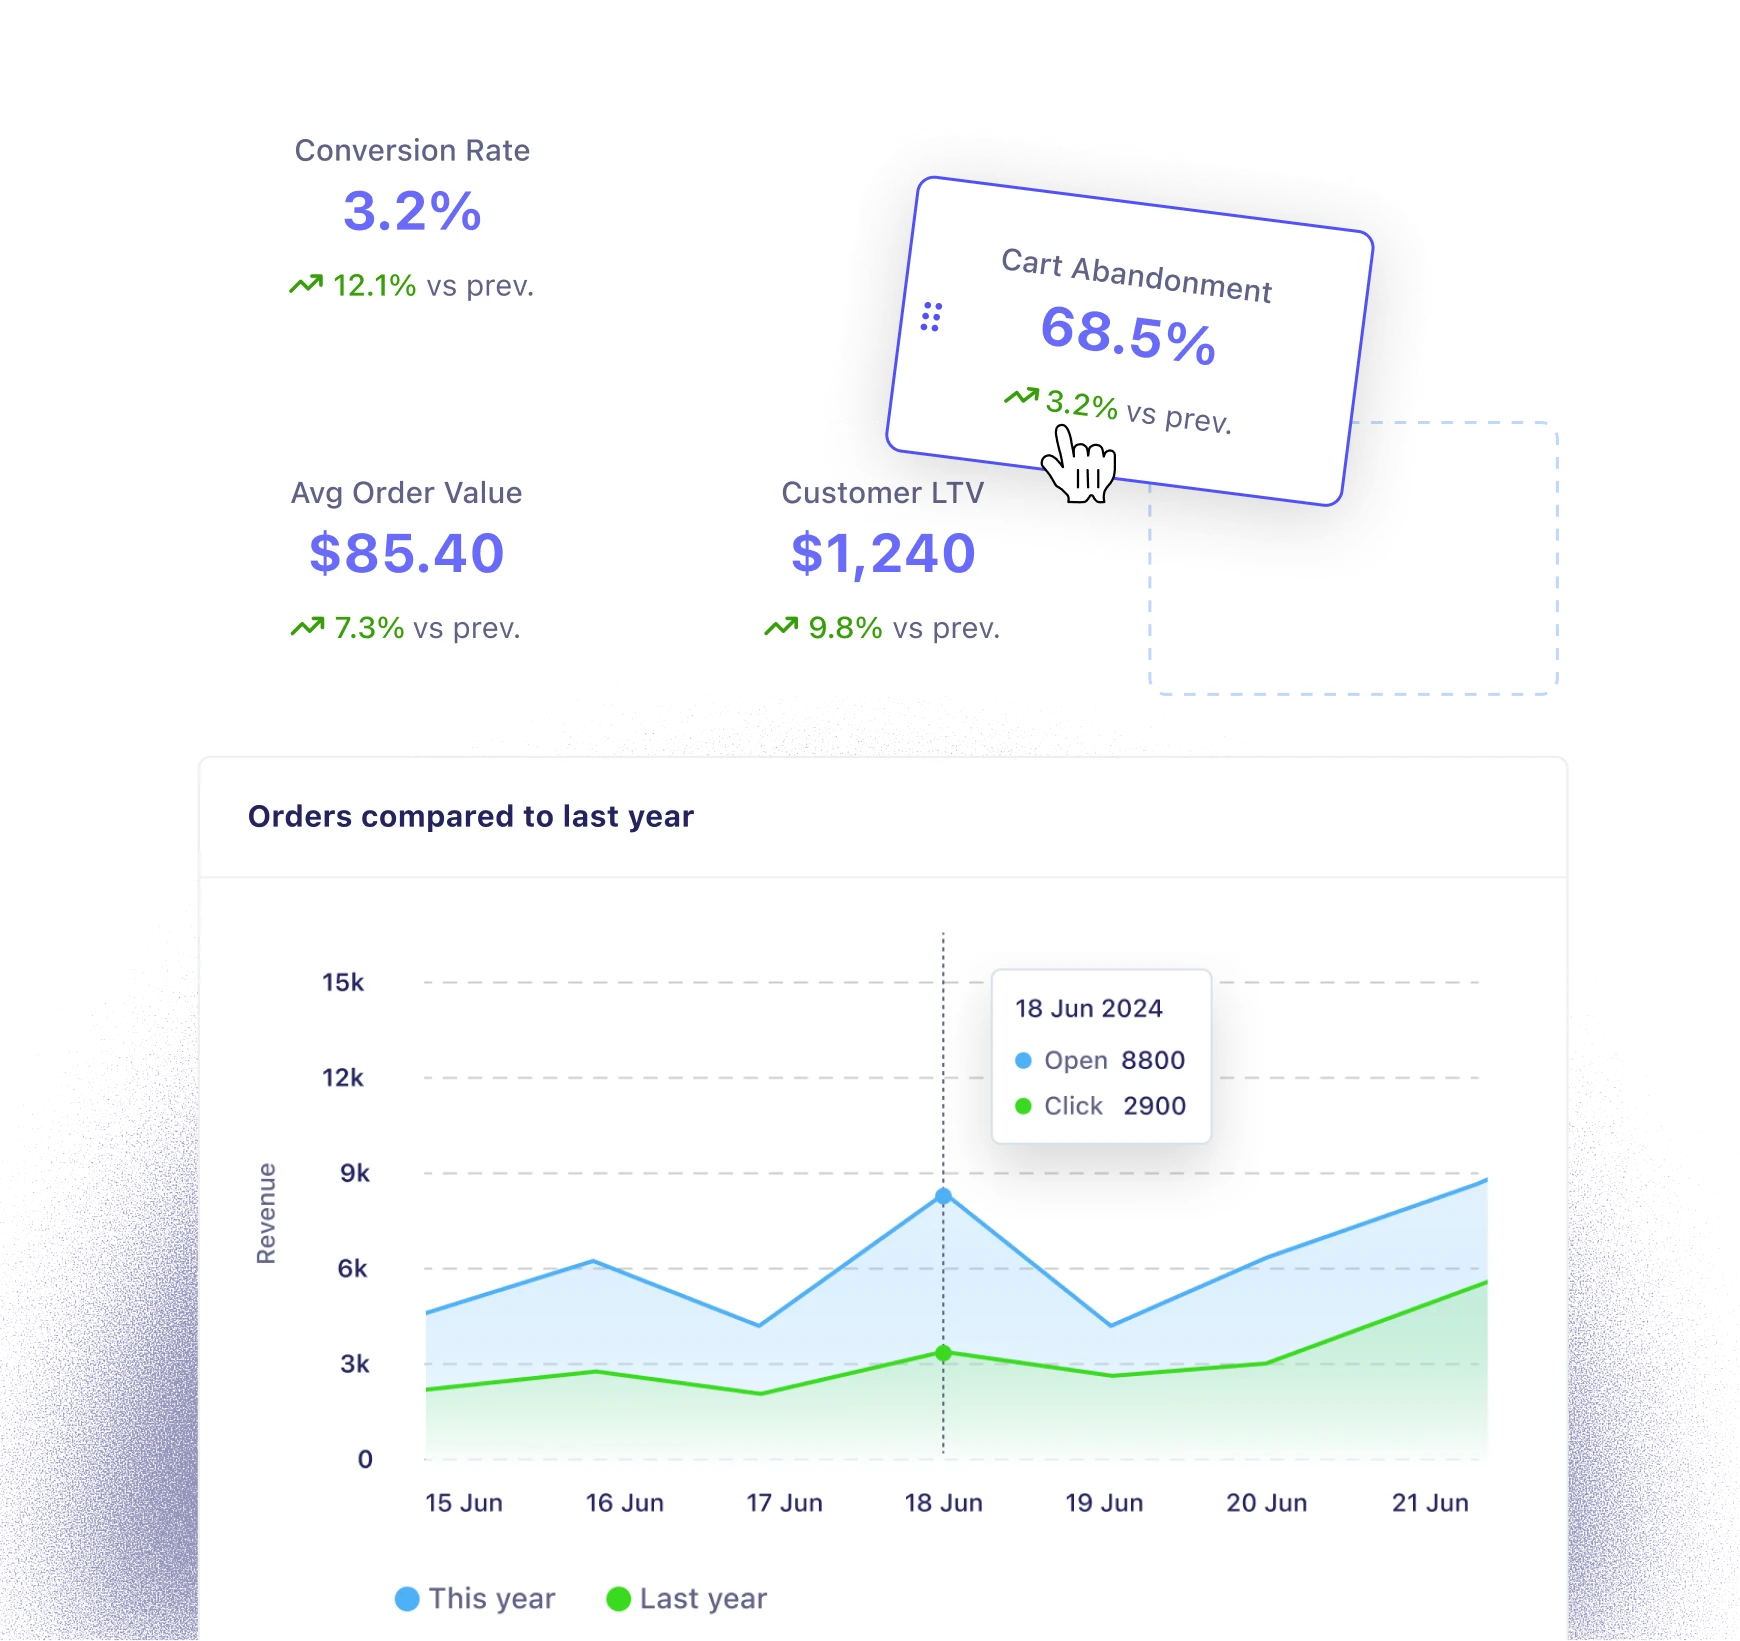
Go from macro trends to operational reality in a single click. Click directly on any active KPI tile to instantly view the raw records driving that number.
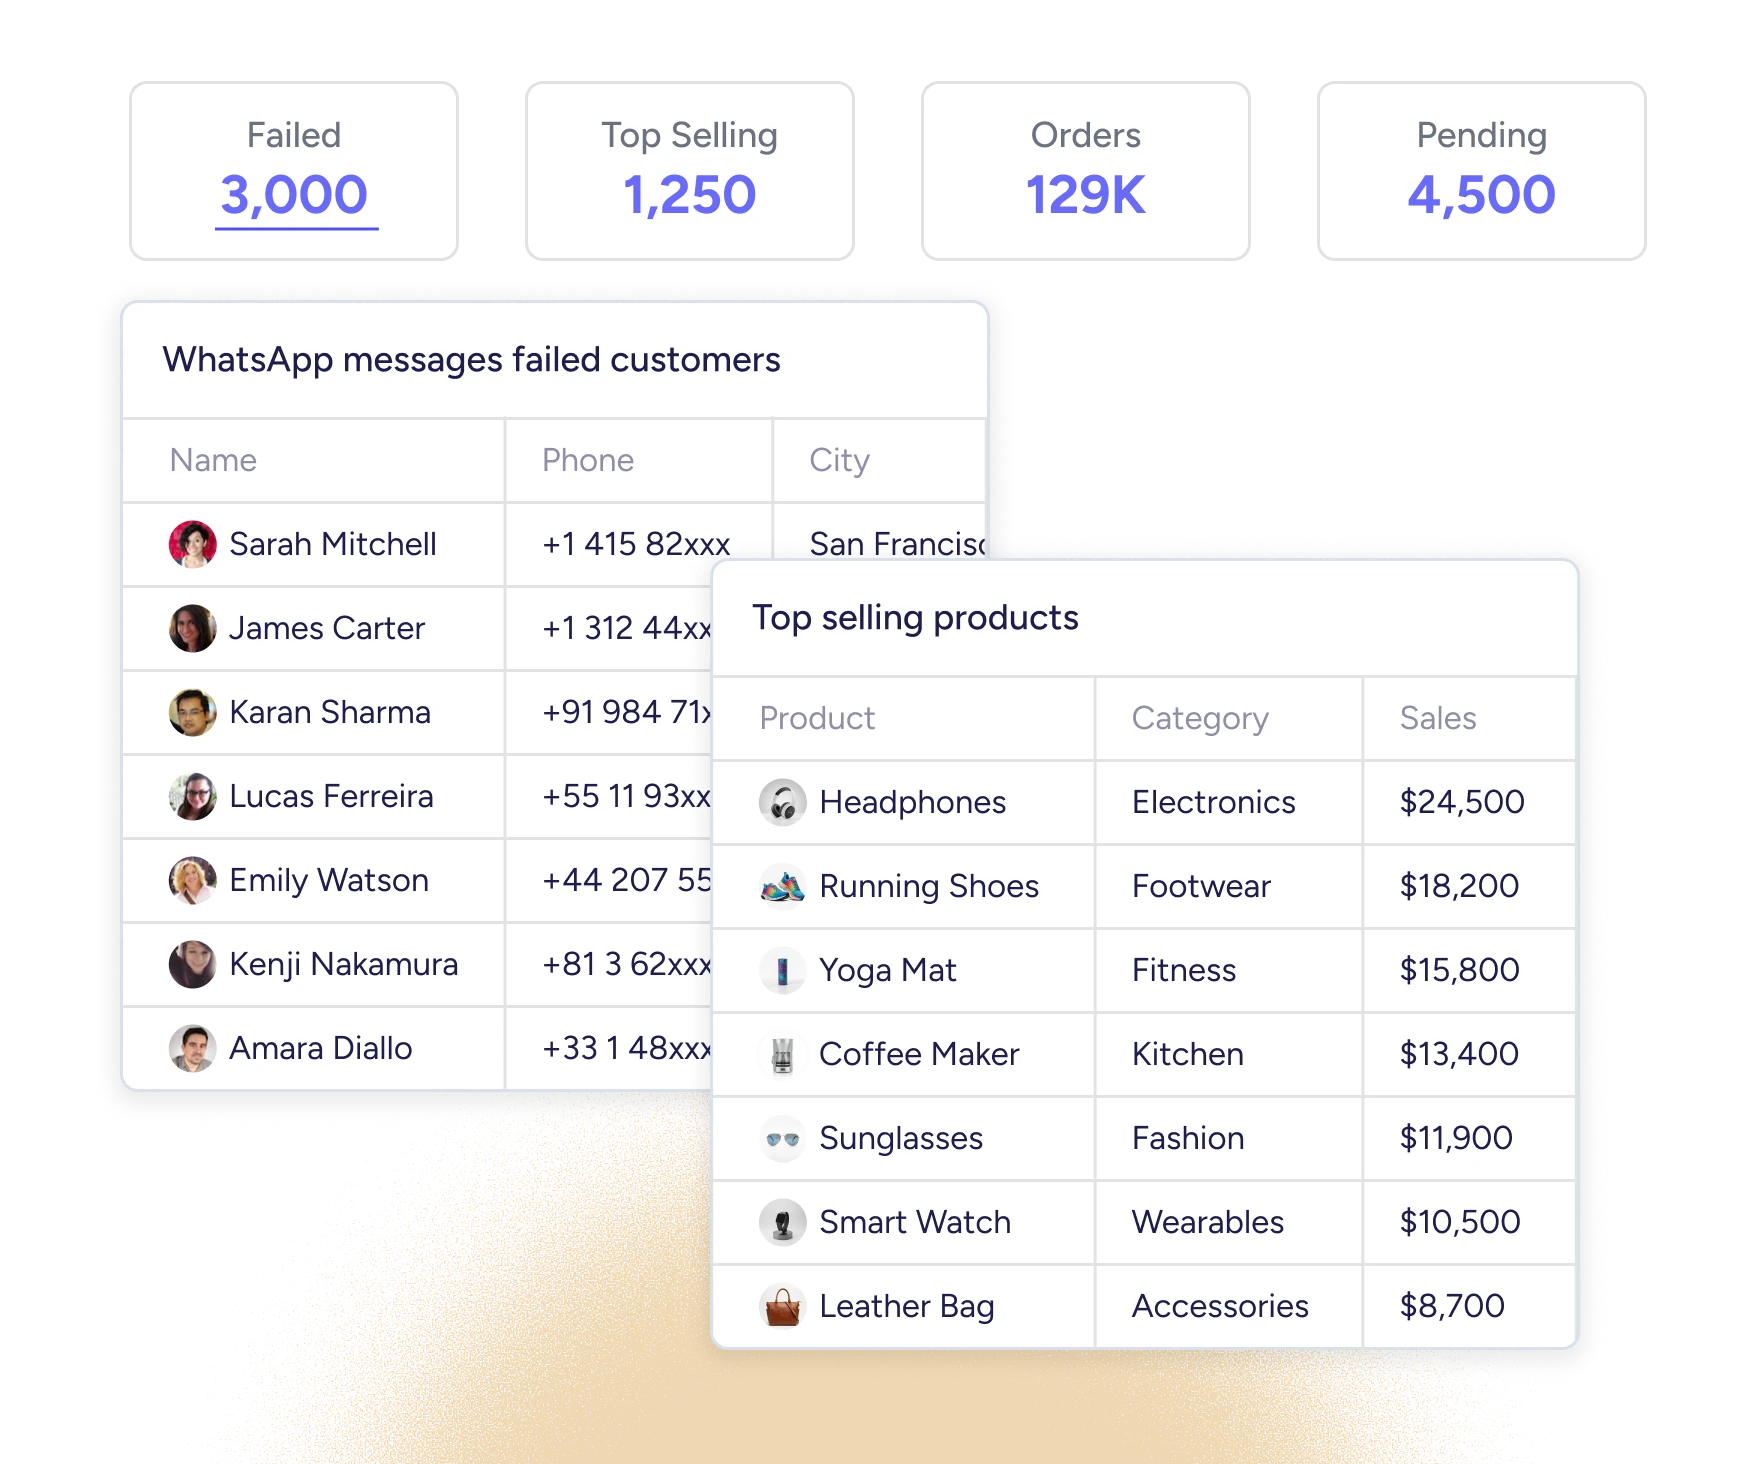
Group related reports into boards with a single date range filter. One view for every metric that matters, built for your team.
Keep boards private for your own analysis or open them to your whole team. Access is controlled at the board level, so the right people always see the right data.
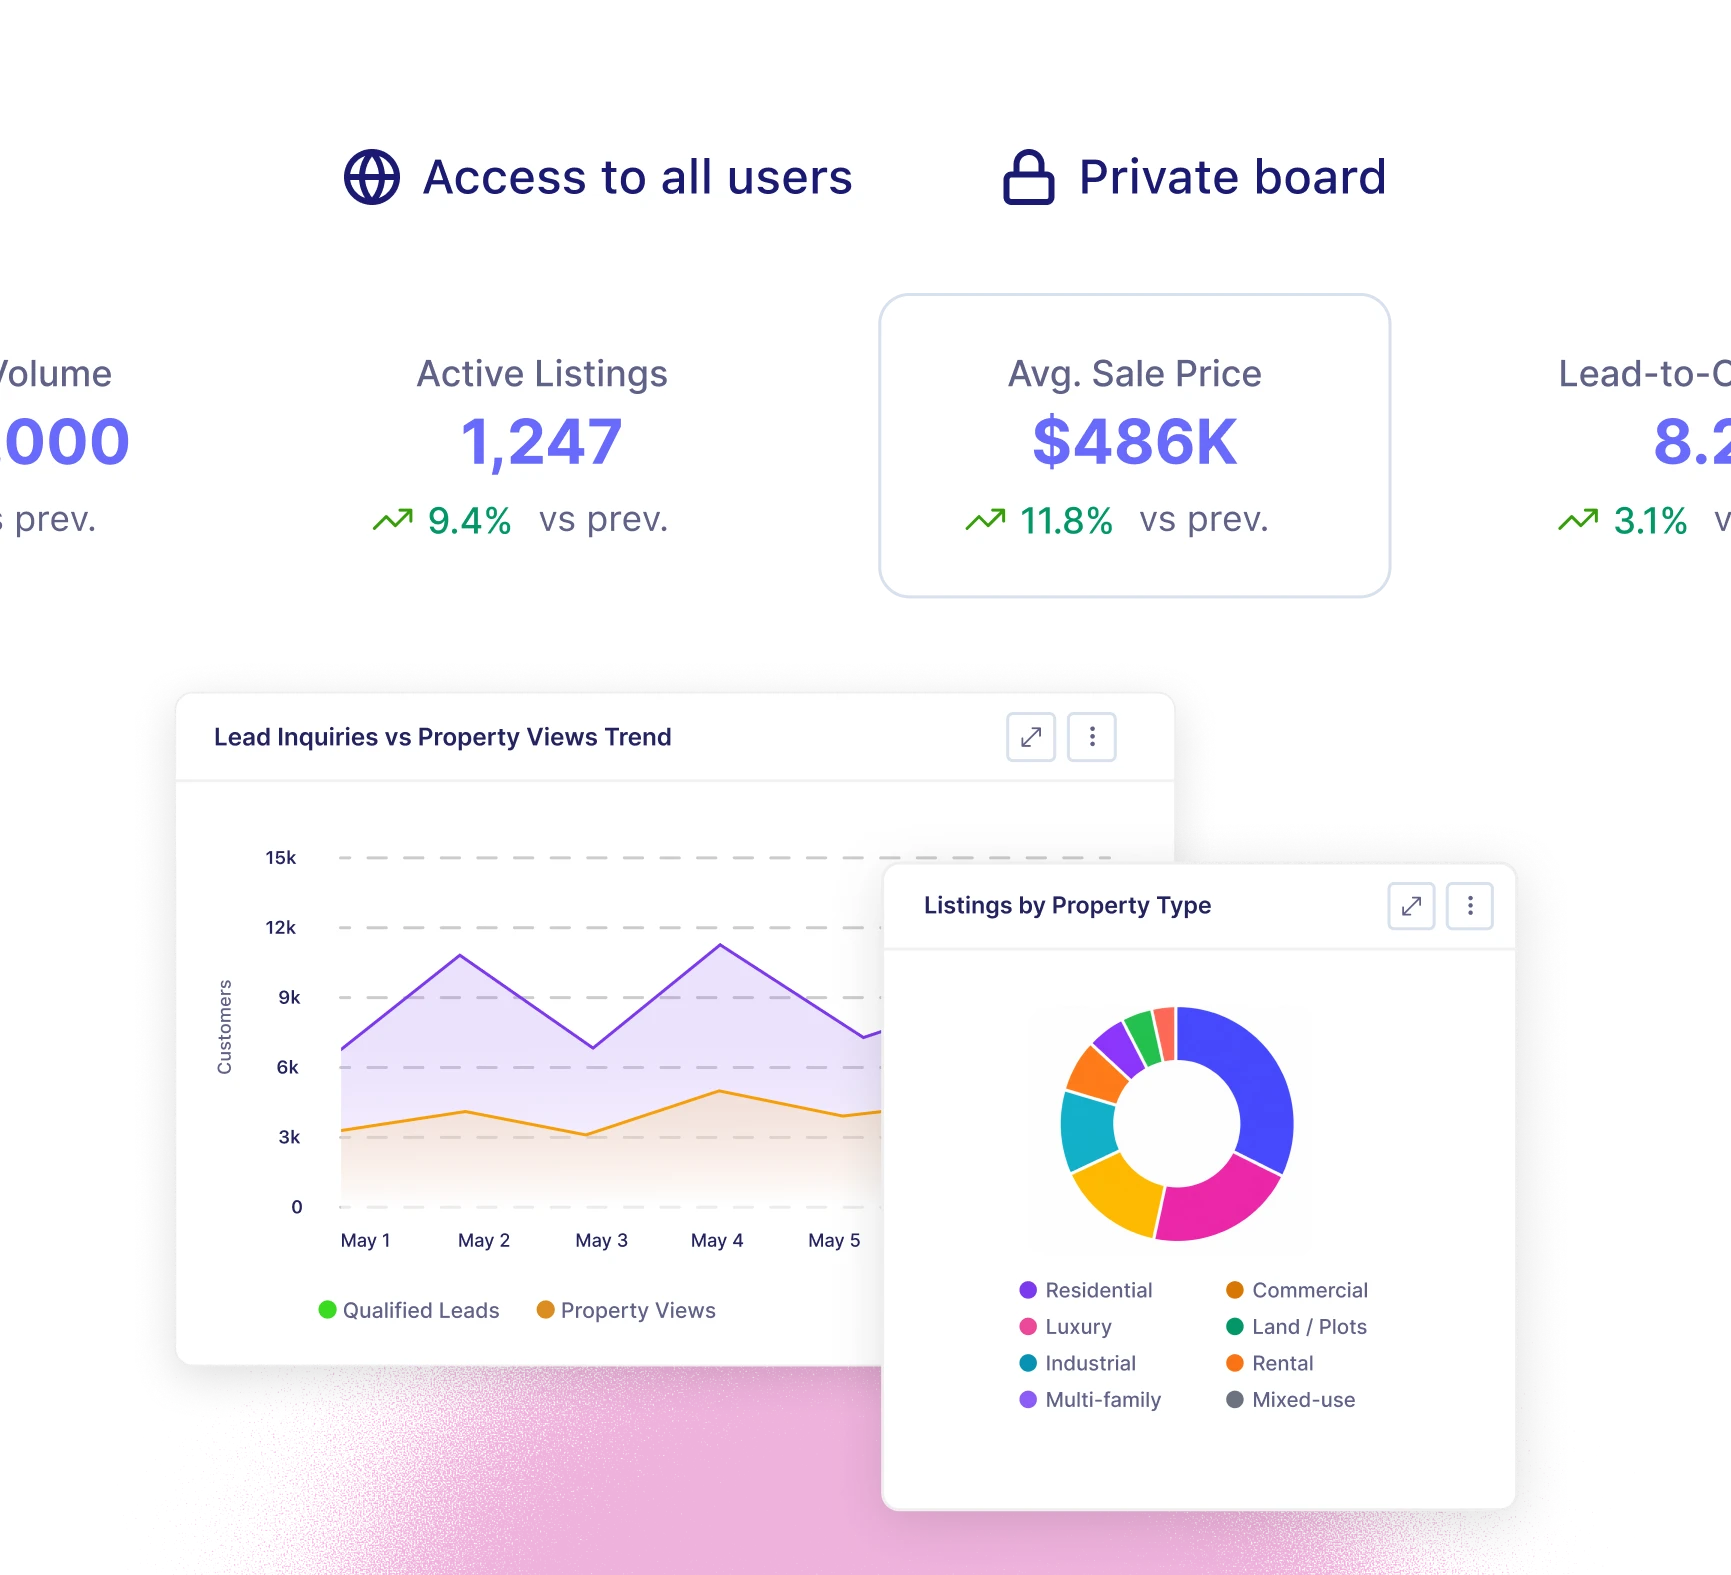
Don’t settle for rigid templates. Build custom reports that answer your business’s specific questions.
Book a DemoA custom report is a fully flexible report you build inside ZEPIC from scratch. You choose the data source, the metrics, the visualization type, and the filters, so the report reflects exactly how your business measures success, not a preset template.
You can create a report on any object, including customers, orders, products, deals, and the events nested under them, such as email opens, WhatsApp replies, completed purchases, and cancelled orders.
No. Custom reports are built with a drag-and-drop interface. You select your data source, choose your metrics, apply filters, and pick a visualization type
Yes. Every report supports built-in period-over-period comparison. Toggle it on, and ZEPIC automatically benchmarks your current performance against the previous matching period.
A board is a collection of related reports grouped together under a single date range filter. Instead of opening five separate reports, you build one board that gives your team a complete view of every metric that matters.
Yes. Access is managed at the board level. Set a board to public for your whole team to view or keep it private for your own analysis. Owners, admins, and managers can create and edit boards. Other roles get view-only access.
Most analytics tools give you a fixed set of report types you choose from. ZEPIC gives you a blank canvas, so you define the data source, the metrics, the groupings, and the view. There are no templates deciding what you can or can't measure.
Yes. Any report built inside a public board can be added to another board. ZEPIC creates an independent copy so each board manages its own configuration without affecting the original.

%201.png)


