The growth of the travel and hospitality sectors has been remarkable in the past two years, as people make travel a priority. In 2025, the industry’s contribution to global GDP totaled US$11.6 trillion. It grew at 4.1% year on year, exceeding overall global economic growth by almost 50%
Eight months into 2026, how is the industry faring in 2026? Hotels are posting their strongest revenue growth in years while occupancy stays flat.
While restaurants are growing sales even as traffic shrinks and legacy chains file for bankruptcy at a steady clip.
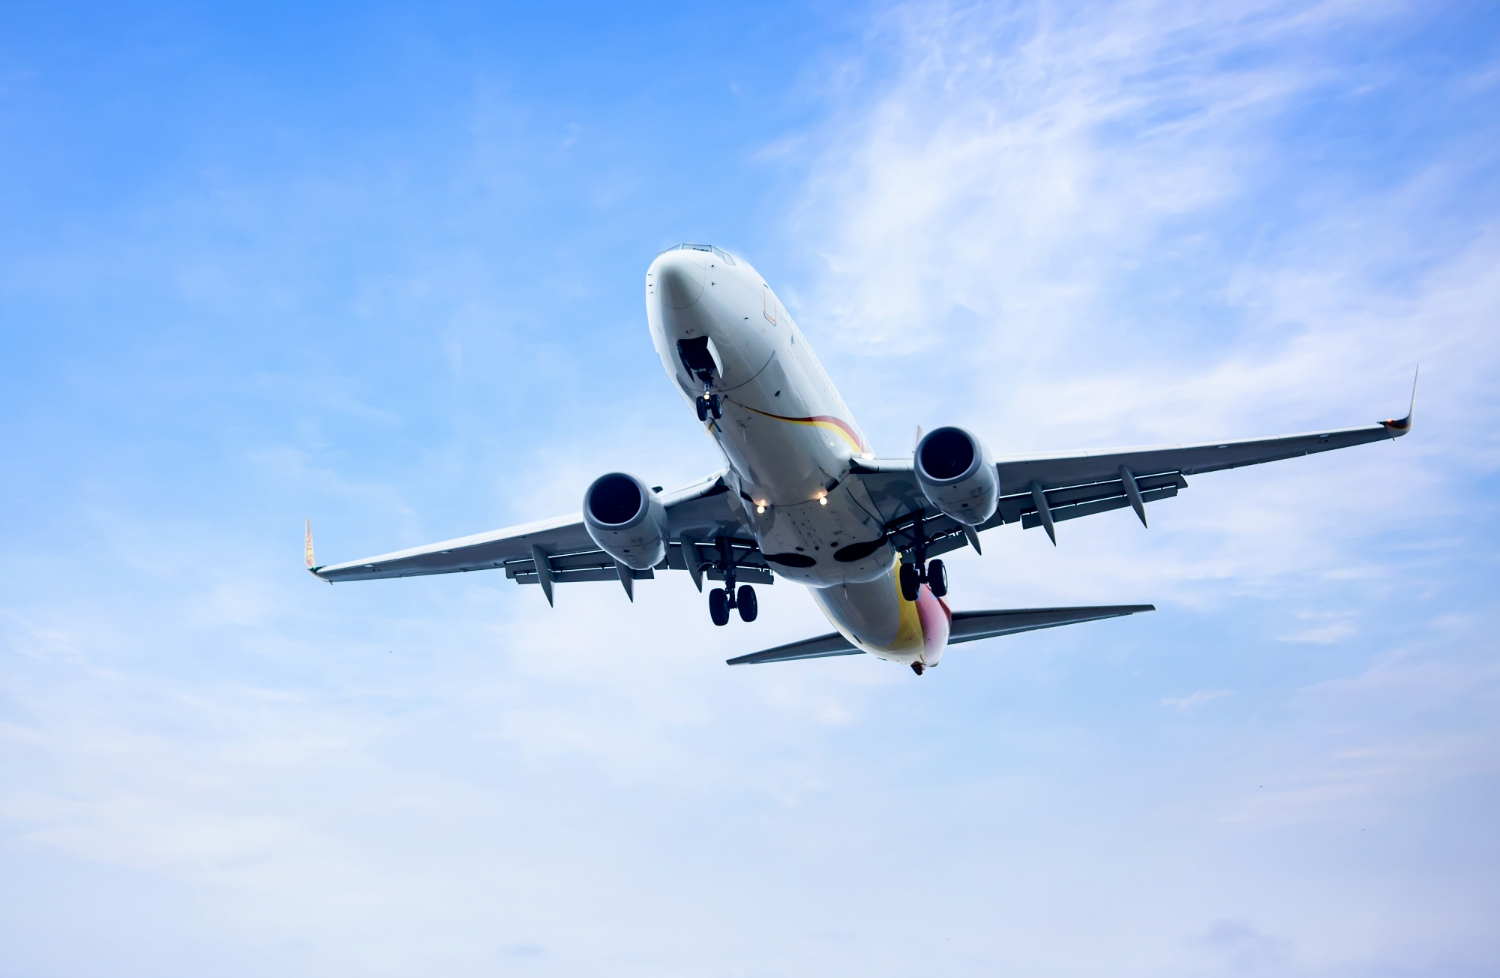
Airlines are hauling in record fares on softer international demand.
Across every vertical, affluent and price-sensitive consumers are pulling in opposite directions, and AI has moved from pilot project to operating infrastructure.
Let’s look at how the industry is evolving and what lies ahead.
Hotels: Record Room Nights, a K-Shaped Guest, and AI as Backbone
For hotels, the year started slow but turned around fast, with growth split sharply by geography, guest income, and brand strategy.
Revenue Per Available Room (RevPAR) Went From Flat to Strong by Midyear
CoStar and Tourism Economics opened 2026 projecting just 0.6% RevPAR growth after 2025 delivered the US hotel industry's first non-recessionary RevPAR decline on record. By midyear, the picture had shifted.
2025 baseline: RevPAR fell 0.3% for the year, with occupancy slipping to 62.3%.
H1 2026 surge:STR president Amanda Hite reported the industry sold 11.4 million more room nights in the first half of 2026 than a year earlier, adding over $5.4 billion in room revenue, fueled by the FIFA World Cup and America's 250th anniversary celebrations.
Revised forecast: CoStar and Tourism Economics lifted their full-year RevPAR forecast to 2.8%, with occupancy revised up to 63.1%.
Growth Is Uneven by Geography and by Guest
Regional performance and guest spending power are diverging.
Asia Pacific: on pace for 3.6% RevPAR growth in 2026.
Middle East: the four major markets (Abu Dhabi, Dubai, Jeddah, Riyadh) were revised up to 4.2%.
Europe: benefited from event-driven spikes, most notably the Milan-Cortina Winter Olympics, where nightly rates briefly topped 500 euros during the opening days.
The wealth effect:Moody's Analytics data show the top 10% of earners accounted for nearly half of all consumer spending in a recent quarter, a concentration Skift Research and Hospitality Net both describe as structural rather than cyclical. Luxury hotel brands are moving toward quiet luxury and local experiences, while also exploring yacht stays and flexible options for multigenerational travel.
Loyalty Is the New Battleground for Direct Bookings
OTA commissions typically run 15% to 25%, higher once promotional placement fees are included.
Guests acquired through a hotel's own CRM rebook at roughly 33%, compared with about 6% for OTA-acquired guests.
That gap is why loyalty platforms are being rebuilt around first-party data and personalization rather than simple points accrual.
AI Is Moving From Guest-Facing Novelty to Operational Infrastructure
The global AI-in-hospitality market is projected to reach $26.53 billion in 2026 and $75.66 billion by 2030.
More than half of hoteliers are already piloting or using AI.
85% of hospitality IT leaders plan to put at least 5% of their IT budget toward it, largely for revenue management, forecasting, and guest messaging.
A newer priority: optimizing for how AI assistants discover and recommend a property, since fragmented data across a hotel's PMS, CRS, and review platforms increasingly determines whether AI tools recommend it at all.
Restaurants: Value Wars, Vanishing Chains, and a Loyalty Reset
The Headline Numbers Mask a Cautious Industry
The National Restaurant Association's 2026 State of the Industry report projects total restaurant and foodservice sales of $1.55 trillion this year and more than 100,000 new jobs, but the tone underneath is cautious.
Only 42% of operators said they were profitable last year.
More than nine in ten cite food, labor, insurance, energy, and swipe fees as significant cost pressures.
Real sales growth is forecast at a modest 1.3%.
Traffic Is Down Even Where Sales Are Up
Monthly tracking from Black Box Intelligence shows why the mood is mixed.
April: Same-store sales grew 1.5% while traffic fell 2.3%, even as gas prices pushed past $4 a gallon, a level that has historically hurt restaurant visits.
The squeeze on the middle: Budget-conscious diners are trading down into quick service, while even affluent, economically anxious diners are downgrading from fine dining to upscale casual.
May: Every region posted positive same-store sales for a third straight month, but Family Dining remained the one segment in outright contraction for the year, propped up by the strongest average check growth of any category even as its traffic kept eroding.
Circana projects industry-wide traffic growth under 1% for 2026, and Black Box found only about a third of tracked brands posted positive comparable sales in 2025.
Loyalty and CRM Have Become the Retention Lever of Choice
52% of Quick Service Restaurant customers belong to at least one program.
The restaurant CRM market, valued at nearly $4.2 billion in 2026, is projected to reach $13.8 billion by 2033.
The channel mix is shifting toward SMS- and WhatsApp-based loyalty that requires no app download, and wallet-based push notifications are reportedly hitting open rates near 90%, well above email or generic promotions.
Travel Brands: Bifurcated Demand, Agentic Booking, and a Record Cruise Season
Demand Is Steady, But Not Accelerating
Skift's Travel Health Index has held flat at 100 through June, meaning demand is steady but not accelerating, even with World Cup anticipation in the mix.
International tourist arrivals are projected to surpass 1.55 billion for the first time this year.
Delta's premium cabin revenue overtook main cabin revenue for the first time in company history in late 2025, a milestone several outlets treat as a bellwether for the industry's broader premiumization, echoing the same wealth concentration reshaping hotels.
Airlines Are Navigating a Volatile Year
IATA data show domestic demand outpacing international through much of 2026 (domestic RPKs up 6.5% in March, for instance), while international traffic fell as Middle East carrier volume collapsed amid regional disruption.
Fares have climbed sharply, up 26.5% year-over-year by June, with carriers showing real pricing power and little visible demand destruction.
Costs climbed just as fast: jet fuel spiked from roughly $2.30 to a peak of $4.88 a gallon around the Iran conflict and Strait of Hormuz disruptions.
IATA cut its global 2026 airline profit forecast from $72.8 billion to $48 billion as a result.
Separately, 2025 saw the slowest pace of new airline startups since 1999, a competition warning sign IATA has flagged directly.
OTAs Face Steady Growth and an Emerging AI Threat
Phocuswright's Travel Forward 2026 report put global gross travel bookings at roughly $1.67 trillion, with online bookings surpassing $1 trillion and growing faster than offline channels, led by Asia Pacific.
Traditional search's share of trip-planning starts has declined as social platforms and AI tools gain ground; Phocuswright found 58% of active US travelers were already using AI for something by late 2025, with 39% using it specifically for travel planning.
US OTA gross bookings rose 4% in 2025 to $100.3 billion.
Booking Holdings spent $2.1 billion on marketing in the first quarter alone, up 16% year-over-year, while also testing ChatGPT ad placements and pursuing the "connected trip" concept it has chased for years.
Q2 2026 nights and experiences booked were up 10% year-over-year, with gross booking value of $27.2 billion, up 16%.
National occupancy has eased from roughly 57% in 2024 to around 50% in early 2026, but rate growth is more than compensating.
Booking windows keep shrinking, with the average January booking lead time falling from 19 days in 2022 to 15 days this year.
Demand for nature and rural stays is climbing sharply, with Airbnb reporting a 35% jump in searches near US national parks for 2026, a shift Skift's Megatrends report ties to a broader move toward wellness, sober travel, and optimizing for how AI assistants surface destinations in the first place.
Travel Trends to Watch in 2026: Events, Remote Work, and the Season Ahead
Travel Built Around a Ticket and Not a Destination
Event-driven travel has become one of 2026's defining patterns.
81% of travelers say major sporting events influence where they go, and 88% said the same about concerts and festivals, according to a survey cited by Chase Travel's CEO.
43% of people now intend to travel specifically for a cultural event, sport, or festival this year.
Expedia's Unpack '26 Travel Trends Report found 57% of travelers are likely to plan a trip centered on a sporting event, with Gen Z and Millennials leading the shift.
The 2026 events calendar is driving this trend, with the FIFA World Cup, Milan-Cortina Winter Olympics, major tennis tournaments, and music tours encouraging more people to travel for live events. The “gig-tripping” trend is also continuing, fueled by major artists like Bad Bunny.
Tourism spending tied to the World Cup alone is expected to exceed $8.1 billion across host markets between June and August, and secondary "spillover" cities outside the official host markets are seeing meaningful booking growth of their own as fans build regional itineraries around match schedules.
Remote Work Keeps Blurring the Business Trip
The line between business and leisure travel keeps eroding.
68% of corporate travelers now extend at least one trip a year for personal time, averaging 2.3 extra nights (GBTA's 2025 Business Travel Index Outlook).
55% of business travelers took at least two blended trips in 2024, per a joint Navan and Skift report; 73% of employees now view bleisure as a corporate perk, and 59% of Gen Z workers say they'd choose an employer partly for its travel flexibility.
Fortune Business Insights sizes the broader bleisure travel market at $762 billion in 2025, projecting it to reach $2.21 trillion by 2034.
A related, smaller but fast-growing segment: Arrivia's research counts 18.1 million workers now identifying as digital nomads, with Millennials the largest cohort of bleisure travelers at 38%.
For hotels and destination marketers, that change shows up as longer average stays, demand for reliable in-room work setups, and growing interest in slow-travel itineraries that trade a packed schedule for weeks spent in one place.
What the Next Few Months of 2026 Look Like
Heading into the back half of 2026, the signals point to continued but more selective demand.
Deloitte's 2026 Travel Industry Outlook flags financial caution spreading even to higher-income travelers, a group that had been the most resilient segment: 53% of frequent corporate travelers (10 or more trips a year) now expect to travel three or more times a month, down from 63% in 2024.
Expedia's quarterly search data shows the seasonal handoff already underway, with September searches for longer-horizon trips (61+ days out) climbing as travelers start locking in end-of-year holidays and early-2027 plans.
Browsers in December are four times as likely to convert to a Q1 booking, even as booking windows keep compressing: more than 30% of US travelers now finalize plans within two weeks of departure.
Holiday Travel: Record Intent, Tighter Wallets
The most recent Deloitte Holiday Travel Survey, covering the Thanksgiving-through-mid-January window, found 54% of Americans planned to travel that season, up 5 points year over year and the highest share in at least five years. The enthusiasm came with caveats:
Average planned spending fell 18% to $2,334.
Planned trip count dropped to 1.83 from 2.14.
57% of travelers said they'd drive instead of fly specifically to save money.
Growth was concentrated among travelers staying with friends and family rather than in paid lodging.
High earners pulled back hardest, cutting planned trips from 2.5 to 1.9.
Yet about a quarter of respondents still qualified as "luxury travelers" under Deloitte's definition, underscoring the same K-shaped split running through hotels, restaurants, and airlines all year.
On volume, AAA's most recent Thanksgiving forecast projected a record 82 million travelers, up 2% year over year, and its year-end forecast projected 122.4 million Americans traveling over the 13-day Christmas-to-New Year's window, also a new record. AAA separately expects US cruise passenger counts to reach 21.7 million in 2026, a 4.5% increase that would mark a fourth consecutive record year.
Black Friday, Cyber Monday, and the Rise of "Travel Tuesday"
Travel brands have carved out their own version of Black Friday weekend, and the data shows it working.
Expedia found the Black Friday, Cyber Monday, and Travel Tuesday week drove a 15% week-over-week jump in search traffic across North America.
Travel Tuesday, the Tuesday after Thanksgiving, is the bigger event for actual deal volume: Hopper found the day sees roughly 3.5 times as many trips planned as an average day, with two to three times as many deals as Black Friday and Cyber Monday combined.
Why: travel demand dips right after Thanksgiving once holiday trips are booked and next year's trips haven't started yet.
McKinsey tracked a fivefold rise in Google searches for "Travel Tuesday" over two years.
The Guest Journey, Personalization, and AI: The Data Behind the Shift
The Path to Booking Has Fragmented
The straight line from search to booking is gone. Search, social platforms, AI assistants, OTAs, review sites, CRM and email, and loyalty apps all now shape a guest's decision before they ever reach a booking page.
Industry commentary on 2026 hospitality marketing describes this as a shift from "channel-led" campaigns (focused on visibility and filling rooms) to "journey-led" management, where paid media, website content, CRM, loyalty, and guest messaging function as one connected system.
Phocuswright's Travel Forward 2026 research backs this up from the consumer side: the share of travelers starting trip planning with a traditional search engine has declined sharply year over year, while social platforms and AI tools pick up a growing share of that early research.
On property, EHL's Hospitality Outlook 2026 points to a parallel shift indoors, with mobile messaging (WhatsApp in particular) increasingly replacing the front-desk phone call as the default channel for guest questions, pre-arrival requests, and in-stay service.
Personalization Is a Baseline Expectation
The data on personalization is consistent across hotels, restaurants, and OTAs alike: guests expect it, and they'll trade data for it, but only on their terms.
57% of travelers believe brands should tailor information to their personal preferences and past behavior (joint Google/Phocuswright travel study).
89% of Gen Z and 87% of Millennials say they're willing to share personal information in exchange for tailored offers, compared with 64% of Baby Boomers (Deloitte).
Younger travelers are also far more likely to opt into hyper-personalized loyalty programs: 62% of Gen Z and 64% of Millennials versus 33% of Boomers.
Dissatisfaction with fast-food and fast-casual loyalty programs nearly doubled to 28% in 2026 from 15% the year before, largely because programs collect guest data without visibly using it.
Where it does work, the payoff is real: 63% of restaurant guests say a specific recommendation or timely follow-up is what brought them back, and hotel loyalty programs that adopted AI-driven personalization report meaningfully higher loyalty-attributed revenue than those that haven't.
How Dependent Is Hospitality on OTAs, Really
Booking Holdings and Expedia Group together are estimated to control roughly 85% to 90% of global OTA hotel bookings.
Independent and boutique properties commonly still route 60% to 75% of their room nights through OTAs.
Standard OTA commissions run 15% to 25%, and effective costs, once preferred-placement and advertising fees are added, can exceed 30%, compared with an all-in cost closer to 5% for a well-run direct channel.
Phocuswright puts US OTA gross bookings at $100.3 billion in 2025, equal to roughly a fifth of all US travel gross bookings, a share projected to reach 21% by 2028.
An estimated 13% of airlines' online passenger revenue still flows through OTAs.
The dependency isn't limited to lodging: Arival's survey of more than 5,000 tour and activity operators found OTA share of global bookings climbed to 37% in 2025 (up from 33%), while direct-operator website bookings slipped from 29% to 25%, evidence that without active investment in a direct channel, operators default into OTA dependency rather than choosing it strategically.
AI Adoption in Travel Is the Fastest the Industry Has Tracked
Phocuswright found 56% of US leisure travelers had used AI for at least one trip in 2026, up from 43% just nine months earlier, a jump the firm called the fastest behavioral shift the travel industry has recorded in more than a decade.
Simon-Kucher's 2026 Global Travel Trends study breaks that adoption down by age and use case: nearly two-thirds of travelers under 45 say they'd use AI for trip recommendations, compared with 44% of Gen X and 29% of Boomers.
Among people who've used AI: 42% built an itinerary with generative AI, 31% searched for flights or hotels, and 28% used a chatbot directly on a booking site.
Trust remains conditional: over half of dissatisfied users blamed inaccurate answers and nearly as many said recommendations felt too generic, so most travelers still treat AI as a fast first pass rather than a final authority.
Supply is scrambling to catch up: a global 2025 survey cited by Statista found four in ten hotel chains planned to implement AI agents, even though fewer than one in ten travel and logistics companies said their AI agent deployments had reached a full scaling phase.
The Common Thread
Read across all three verticals and the trend data above, three patterns repeat:
AI has stopped being a pilot and become infrastructure. It's running drive-thru orders, hotel revenue management, and OTA ad placements alike, and the winners are those whose underlying guest and booking data is clean enough for AI to act on.
The K-shaped consumer is squeezing the middle everywhere. It's rewarding true value and true luxury while punishing anything in between, from Family Dining to mid-tier casual chains to legacy OTAs.
First-party data and loyalty are the main defense against both rising acquisition costs and AI-driven disintermediation, whether that's a hotel chasing direct bookings, a restaurant building an app-less SMS loyalty program, or an OTA trying to stay relevant as travelers start asking a chatbot to plan their trip instead.
Why This Points to One Fix: A Customer Data Platform
Every trend in this piece traces back to the same root problem. Guest and traveler data is scattered across more systems than ever, and scattered data can't be personalized well, can't feed AI reliably, and can't defend a direct relationship against OTA disintermediation.
The Data Problem Hiding Inside Every Trend Above
AI needs clean, connected data to work. The research above is consistent on this: AI agents are only as good as the guest data behind them, and fragmented data across a PMS, POS, booking engine, and review platform is a big reason so many AI pilots stall before reaching a full scaling phase.
Personalization only works with a single customer view. The 57% to 89% of travelers who expect tailored offers won't get them from a brand that has one system for bookings, another for loyalty, and a third for email and WhatsApp, none of which talk to each other.
The direct-booking gap is a data gap, not just a discount gap. The 33% versus 6% rebooking difference between CRM-acquired and OTA-acquired guests exists because brands with a real guest profile can recognize, message, and re-engage that guest directly. Brands without one stay dependent on the OTA to reintroduce them.
Guest journeys now cross channels most tech stacks were never built to connect, including WhatsApp, SMS, Instagram, and email, which is exactly why "channel-led" marketing is giving way to "journey-led" marketing industry-wide.
Turning Fragmented Data Into Revenue: How ZEPIC Helps
ZEPIC's built-in CDP pulls guest data from 50+ tools, including hospitality-specific systems like RMS Cloud, into a single Customer 360 profile, then uses its Zenie AI engine to turn that unified data into personalized, triggered campaigns across email, WhatsApp, SMS, and Instagram. Tourism Fiji uses ZEPIC's unified data model to run personalized engagement at scale across its tourism operators, without stitching together separate tools for data, segmentation, and messaging.
If your team is still piecing guest data together across a PMS, a booking engine, an email tool, and a WhatsApp inbox, that's the gap a built-in CDP closes.
Book a free ZEPIC demo to see how a unified Customer 360 view can turn today's scattered guest data into tomorrow's personalized journeys, or explore ZEPIC for Travel & Hospitality to see it built for this industry specifically.




.jpg)



%201.png)


.png)